TikTok Shop Live Commerce KPI Dashboard
Learn how to build a real-time TikTok Shop live commerce KPI dashboard that tracks revenue by segment, optimizes host performance, and turns live stream data in
You just wrapped a three-hour live stream. Your host was energetic, the comments were flowing, and you moved decent volume. But when your CMO asks which 15-minute window drove the most revenue, you're scrolling through TikTok Seller Center screenshots trying to piece it together like a crime scene.
- Build a real-time live commerce dashboard instead of post-stream spreadsheets — brands using real-time data adjustments generate 47% higher GMV per stream.
- Track GPM (GMV Per Mille) as your top efficiency metric, targeting $80–$250 for most categories and $300+ for beauty and supplements.
- Swap pinned products mid-stream when CTR drops below 3% and extend segments when GPM spikes to maximize revenue in real time.
- Start building your proprietary analytics system now — within 90 days of consistent tracking, you'll compound a data advantage competitors can't replicate.
- Monitor all 8 revenue-driving KPIs including viewer-to-buyer conversion rate and average watch time, not vanity metrics like total viewers.
That's not analytics. That's archaeology.
If you're still pulling TikTok Shop live commerce KPIs manually — copying numbers into spreadsheets after every stream, guessing which pinned product actually converted, or estimating your GPM based on vibes — you're leaving tens of thousands of dollars on the table every single month.
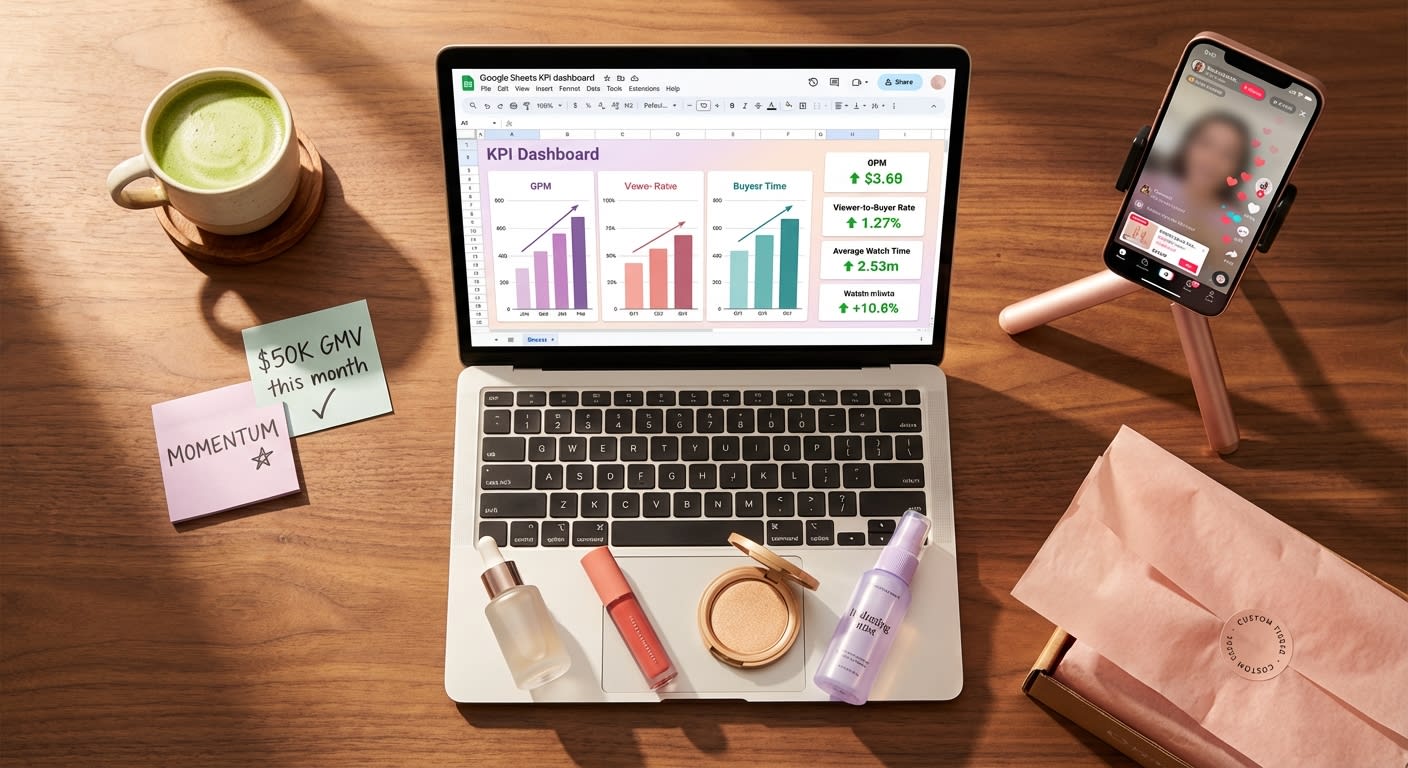
This guide goes far beyond defining metrics. We already covered that in our companion piece on the 14 metrics that separate 6-figure streams from dead air.Today, we're building the actual TikTok Shop live analytics dashboard — a real-time command center in Google Sheets or Notion that auto-tracks GPM, viewer-to-buyer conversion rate, average watch time, pinned product CTR, and every other KPI that separates brands printing money from brands burning it.
Let's build.
Why Most TikTok Shop Sellers Are Flying Blind on Live Commerce Data
Here's what most sellers get wrong: they treat live stream analytics as a post-mortem exercise. Stream ends, someone exports a CSV, numbers land in a spreadsheet two days later, and by then, the insights are stale.

Meanwhile, the brands crushing it on TikTok Shop live are making real-time adjustments during streams — swapping pinned products when CTR drops below 3%, extending segments when GPM spikes, and pulling hosts off camera when average watch time craters.
The difference isn't talent. It's infrastructure.
According to TikTok's 2024 Commerce Report, live shopping sessions with real-time data-driven adjustments generate 47% higher GMV per stream compared to streams run on instinct alone.And yet, a 2024 Statista survey found that only 22% of e-commerce sellers using live commerce have any form of centralized KPI tracking.
That gap is your opportunity — but it's closing fast.
Brands building live analytics dashboards now are compounding a data advantage that latecomers literally cannot replicate. Every stream feeds the system, every data point sharpens the model, and within 90 days, you're operating with a playbook your competitors can't reverse-engineer because it's built on your proprietary performance data.
The 8 TikTok Live Commerce KPIs Your Dashboard Must Track
Before we build the dashboard, let's lock in the metrics that actually matter. Not vanity metrics. Not "total viewers" that make your recap deck look pretty. Revenue-driving KPIs that directly correlate with GMV.
Your TikTok Shop live stream data tracking system needs these eight pillars:
1.GPM (GMV Per Mille)
What it measures: Revenue generated per 1,000 viewers.
Why it matters: GPM is the single most important efficiency metric in live commerce. A stream with 50,000 viewers and $2,000 GMV ($40 GPM) is dramatically underperforming compared to a stream with 8,000 viewers and $1,600 GMV ($200 GPM). TikTok's algorithm also uses GPM signals to determine whether to push more traffic to your stream.
Target benchmark: $80–$250 GPM for most consumer product categories. Beauty and supplements regularly hit $300+.
2.Viewer-to-Buyer Conversion Rate
What it measures: Percentage of unique viewers who complete a purchase.
Why it matters: This is your live stream's bottom-of-funnel efficiency. According to eMarketer's 2024 Social Commerce Report, the average TikTok live shopping conversion rate sits at 2.4%, but top-performing streams consistently hit 6–9%.
Formula: (Total Orders / Unique Viewers) × 100
3. Average Watch Time
What it measures: How long viewers stay before bouncing.
Why it matters: TikTok's live ranking algorithm heavily weights retention. Streams with average watch times above 3.2 minutes receive 2.8x more algorithmic traffic distribution than those under 90 seconds, according to TikTok's Creator Academy data from Q4 2024.
4. Pinned Product CTR
What it measures: Click-through rate on the product card pinned during the stream.
Why it matters: This is the bridge between entertainment and commerce. If viewers are watching but not clicking, your product positioning, pricing display, or pin timing is broken.
Target benchmark: 8–15% CTR on pinned products.
5. Add-to-Cart Rate (From Live)
What it measures: Percentage of product card clicks that result in an add-to-cart action.
Why it matters: A high CTR with a low add-to-cart rate signals a pricing or trust objection. A low CTR with a high add-to-cart rate means your pin timing needs work but your offer is strong.
6. Cart-to-Purchase Completion Rate
What it measures: How many add-to-carts convert to completed orders.
Why it matters: Drop-off here usually indicates shipping cost surprises, checkout friction, or coupon code confusion. This is the most fixable leak in your funnel.
7. Revenue Per Minute (RPM)
What it measures: Total GMV divided by stream duration in minutes.
Why it matters: RPM tells you whether longer streams are actually more profitable or just more exhausting. Most brands discover that their RPM peaks between minutes 25–45 and again around minute 90 — the data tells you exactly when to schedule your hero product drops.
8.Comment-to-Conversion Ratio
What it measures: Correlation between comment velocity and purchase spikes.
Why it matters: This reveals which engagement tactics (giveaways, flash discounts, Q&A segments) actually drive revenue vs. just inflate vanity engagement numbers.
Not sure which KPIs matter most for your specific product category? Talk to a Strategist builds custom live commerce analytics frameworks for brands across beauty, supplements, fashion, home goods, and 30+ other TikTok Shop categories. Book your free TikTok Shop growth audit to see exactly which metrics are costing you GMV — and how to fix them in 30 days.
How to Build Your TikTok Shop Live Analytics Dashboard in Google Sheets
Let's get tactical. Here's the step-by-step system to build a live, auto-updating TikTok Shop live analytics dashboard that your entire team can access during and after every stream.
Step 1: Set Up Your Data Architecture
Create a Google Sheet with four tabs:
- Raw Data Input — Where stream-level data lands after each session
- KPI Calculator — Automated formulas that transform raw data into the 8 KPIs above
- Stream Comparison — Side-by-side performance across your last 30 streams
- Trend Dashboard — Charts and conditional formatting that surface patterns at a glance
Pro tip: Color-code each tab and lock the formula cells so team members can input data without breaking calculations.
Step 2: Build Your Raw Data Input Template
Your Raw Data Input tab needs these columns for every stream:
| Column | Data Point | Source |
|---|---|---|
| A | Stream Date | Manual |
| B | Stream Duration (minutes) | TikTok Seller Center |
| C | Total Unique Viewers | TikTok Seller Center |
| D | Peak Concurrent Viewers | TikTok Seller Center |
| E | Total GMV ($) | TikTok Seller Center |
| F | Total Orders | TikTok Seller Center |
| G | Total Product Card Clicks | TikTok Seller Center |
| H | Total Add-to-Carts | TikTok Seller Center |
| I | Total Comments | TikTok Seller Center |
| J | Total Shares | TikTok Seller Center |
| K | Total Followers Gained | TikTok Seller Center |
| L | Pinned Product Name | Manual |
| M | Pinned Product Impressions | TikTok Seller Center |
| N | Pinned Product Clicks | TikTok Seller Center |
| O | Host Name | Manual |
| P | Stream Theme/Campaign | Manual |
Step 3: Build Automated KPI Formulas
In your KPI Calculator tab, set up these formulas that auto-populate when raw data is entered:
GPM:
=(E2/C2)*1000
Viewer-to-Buyer Rate:
=(F2/C2)*100
Average Revenue Per Minute:
=E2/B2
Pinned Product CTR:
=(N2/M2)*100
Add-to-Cart Rate:
=(H2/G2)*100
Cart-to-Purchase Rate:
=(F2/H2)*100
Comment-to-Order Ratio:
=I2/F2
Average Order Value:
=E2/F2
Use conditional formatting aggressively. Set cells to turn green when KPIs exceed your benchmarks, yellow when they're within 10%, and red when they fall below. Your dashboard should be readable in two seconds flat.
Step 4: Automate Data Flow With Zapier or Make
Here's where most sellers stop — and where the real competitive advantage begins.

Manual data entry is the enemy of consistency. After three weeks, someone forgets to update the sheet. After six weeks, you've got gaps. After two months, the dashboard is abandoned.
Instead, set up an automation workflow:
- Export TikTok Seller Center data via their reporting API or scheduled CSV exports
- Use Zapier or Make (formerly Integromat) to parse the CSV and push data into your Google Sheet automatically
- Set a trigger for every stream end — data lands in your Raw Data tab within 15 minutes of going offline
If you don't have API access, use the semi-automated approach:
- Schedule a daily Zapier trigger that checks a designated Google Drive folder for new CSV uploads
- When a new file appears, Zapier parses the data and appends it to your Raw Data tab
- Your team's only job: download the CSV from Seller Center and drop it in the folder
This takes the process from 25 minutes of manual work per stream to under 90 seconds.
Step 5: Build the Trend Dashboard
Your Trend Dashboard tab should include four auto-updating charts:
- GPM Over Time (line chart) — Reveals whether your streams are getting more efficient or less
- Viewer-to-Buyer Rate by Host (bar chart) — Shows which hosts actually convert, not just entertain
- Pinned Product CTR by Product Category (bar chart) — Identifies which product types perform best in live format
- RPM by Time Slot (scatter plot) — Reveals your optimal streaming windows
Bold insight: The brands generating $100K+ per month from TikTok Shop live aren't running more streams — they're running smarter streams, informed by exactly this kind of data infrastructure.
The Notion Alternative: Building a Live Commerce Command Center for Teams
If your team lives in Notion rather than Google Sheets, here's how to adapt the system:
Notion Database Structure
Create a Live Stream Database with these properties:
- Date (Date property)
- Host (Select property — pre-populate with your host roster)
- Duration (Number, in minutes)
- Unique Viewers (Number)
- GMV (Number, formatted as currency)
- Orders (Number)
- GPM (Formula:
prop("GMV") / prop("Unique Viewers") * 1000) - Conversion Rate (Formula:
prop("Orders") / prop("Unique Viewers") * 100) - RPM (Formula:
prop("GMV") / prop("Duration")) - Pinned Product CTR (Number, entered as percentage)
- Stream Rating (Select: 🔴 Below Target / 🟡 On Pace / 🟢 Outperforming)
- Key Learnings (Text — brief post-stream notes)
Notion Dashboard Views
Create these saved views:
- Calendar View — See stream frequency and identify scheduling gaps
- Table View filtered by Host — Compare host performance instantly
- Gallery View sorted by GPM — Visual ranking of your best-performing streams
- Board View grouped by Stream Rating — Drag-and-drop categorization for team reviews
Notion + Google Sheets Hybrid
Here's the power move: Use Notion as your team-facing command center and Google Sheets as your calculation engine. Embed your Google Sheets charts directly into Notion pages using the embed block. Your team gets the clean Notion interface while the heavy computation happens in Sheets.
Real-Time Adjustments: How to Use Your Dashboard During Live Streams
A dashboard that only gets checked after streams is a report. A dashboard that gets checked during streams is a weapon.
Here's how to operationalize real-time TikTok live commerce KPIs:
Assign a "Data Pilot" Role
During every live stream, one team member should be dedicated to monitoring the dashboard and feeding insights to the host via an earpiece or chat.
Their job:
- Monitor viewer count trajectory — If viewers are declining, signal the host to launch an engagement hook (giveaway, flash deal, controversial take)
- Track pinned product CTR in real-time — If CTR drops below 5% after 10 minutes, swap the pinned product
- Watch comment velocity — Spikes in comments correlate with algorithmic boosts; the data pilot should identify what triggered the spike and tell the host to double down
- Flag GPM drops — If GPM falls below target for more than 15 minutes, it may be time to introduce a bundle deal or limited-time offer
The 15-Minute Checkpoint System
Break every stream into 15-minute segments. At each checkpoint, your data pilot evaluates:
- Is GPM above or below our session target?
- Has average watch time increased or decreased vs. the last segment?
- Which pinned product had the highest CTR in this window?
- What was the comment-to-order ratio?
This creates a real-time feedback loop that transforms every stream from a performance into an optimization experiment.
One home goods brand implemented this exact system and increased their average stream GMV by 62% in just six weeks — without changing their host, their products, or their streaming schedule. The only variable was data-informed real-time adjustments.
Building this infrastructure yourself sounds great in theory — but most brands stall at execution. Between managing creators, optimizing product listings, running ads, and actually fulfilling orders, who has time to build and maintain a live analytics command center? That's exactly why brands partner with Talk to a Strategist. As TikTok Shop Partner of the Year, MomentIQ brings proprietary analytics infrastructure, algorithmic creator matching, and full-stack live commerce support — so you get the data advantage without the build time. Schedule a free strategy session at bemomentiq.com to see your custom live commerce scaling roadmap.
Advanced Dashboard Features: Leveling Up From Tracking to Predicting
Once your basic dashboard is running, these advanced features separate good analytics from game-changing intelligence:
Host Performance Scoring
Create a weighted composite score for each host:
Host Score = (GPM × 0.35) + (Conversion Rate × 0.25) + (Avg Watch Time × 0.20) + (Follower Gain Rate × 0.10) + (Comment Velocity × 0.10)
Normalize each metric to a 0–100 scale so they're comparable, then rank your hosts. You'll quickly discover that your most entertaining host isn't necessarily your most profitable one — and that insight alone can restructure your entire streaming calendar.
Product-Stream Fit Analysis
Track which products perform best in which stream contexts:
- Product A might crush it in educational "how-to" streams but underperform in flash sale events
- Product B might spike during evening streams but flatline during daytime sessions
- Bundle offers might outperform single-SKU pins by 3x on weekends but show no lift on weekdays
Build a pivot table that cross-references product × stream type × time slot × host to find your highest-converting combinations.
Cohort Analysis by Traffic Source
TikTok Seller Center provides limited traffic source data, but you can approximate cohort behavior by tracking:
- Streams promoted via Spark Ads vs. organic-only streams
- Streams cross-promoted by affiliate creators vs. brand-only promotion
- Streams during TikTok Shop promotional events vs. standard days
This reveals where your highest-quality live traffic originates — and where to invest your amplification budget.
Why "We'll Just Track This Ourselves" Usually Fails at Scale
Let's address the elephant in the room.
You might be reading this thinking, "Great framework — my team can build this." And if you're running one or two streams per week with a single host, maybe you can.
But here's what happens when you try to scale:
- At 5+ streams per week, manual data entry breaks down. Someone misses a stream, formulas break, and your dashboard becomes unreliable.
- At 10+ streams per week (which is where serious GMV lives), you need dedicated analytics headcount. That's a $65K–$90K/year salary for someone who only manages live commerce data.
- When you add multiple hosts, products, and stream formats, the combinatorial complexity explodes. Your simple Google Sheet becomes a monster that takes 3 hours to maintain for every hour of insight it delivers.
This is the scale wall that separates brands doing $20K/month in live commerce from brands doing $200K+.
Generic influencer agencies won't solve this either. Most agencies understand Instagram and YouTube — they don't understand TikTok Shop's unique commerce mechanics, live stream algorithmic signals, or the GPM-driven traffic distribution system that makes or breaks live revenue.
And that's exactly why Talk to a Strategist exists.
As a TikTok Marketing Partner and TikTok Shop Partner of the Year, MomentIQ brings proprietary data infrastructure that goes far beyond what any Google Sheet can deliver. Our algorithmic creator matching system — powered by the Reacher platform — doesn't just find creators; it predicts which creators will drive the highest GPM for your specific product category based on historical live commerce performance data.
One supplement brand came to MomentIQ doing $18K/month in total TikTok Shop revenue with inconsistent live stream performance. Within 90 days, they scaled to $420K/month — driven primarily by optimized live commerce strategy, data-informed host selection, and real-time stream optimization protocols.
A beauty brand struggling with sub-2% live conversion rates implemented MomentIQ's analytics framework and hit 7.3% conversion within 60 days, tripling their per-stream GMV without increasing their streaming frequency.
These aren't flukes. They're the predictable result of replacing guesswork with data infrastructure.
The Cost of Waiting: Why Every Week Without a Dashboard Compounds Your Losses
Let's do the math that most sellers avoid.
Assume you're running 4 live streams per week at an average of $3,000 GMV per stream. That's $12,000/week, or roughly $48,000/month.
Brands with optimized live analytics dashboards consistently improve stream performance by 25–40% within 90 days (based on aggregate industry benchmarks from TikTok's 2024 Commerce Accelerator program data).
At a conservative 30% improvement:
- Current monthly live GMV: $48,000
- Optimized monthly live GMV: $62,400
- Monthly revenue left on the table: $14,400
- Quarterly cost of inaction: $43,200
- Annual cost of inaction: $172,800
That's $172,800 in revenue you're not capturing because you don't have a system to identify and fix what's broken.
And here's the compounding problem: while you're flying blind, your competitors are building their data advantage. Every stream they optimize feeds their system with more intelligence. Every week you wait, the gap widens.
TikTok Shop's live commerce GMV grew 215% year-over-year in 2024, according to TikTok's official commerce data. The brands establishing data infrastructure now are positioning themselves to capture a disproportionate share of a market that Statista projects will reach $17.5 billion in US social commerce live shopping by 2026.
The window is open. But it won't stay open forever.
Your Dashboard Launch Checklist
Here's your action plan, distilled into a single checklist:
- Choose your platform — Google Sheets for calculation power, Notion for team collaboration, or hybrid for both
- Build your Raw Data Input tab with all 16 data columns
- Set up automated KPI formulas for all 8 core metrics
- Add conditional formatting with green/yellow/red thresholds based on your category benchmarks
- Create trend charts for GPM, conversion rate, watch time, and pinned product CTR
- Set up Zapier/Make automation to reduce manual data entry to under 90 seconds per stream
- Assign a Data Pilot for every live stream
- Implement the 15-minute checkpoint system for real-time optimization
- Build host performance scoring after your first 10 tracked streams
- Run your first product-stream fit analysis after 30 tracked streams
- Review and iterate the dashboard monthly — add metrics, remove noise, refine benchmarks
Stop Guessing. Start Scaling.
The difference between brands doing $10K/month in live commerce and brands doing $300K/month isn't better products, more charismatic hosts, or bigger ad budgets.
It's better data infrastructure.
Every stream you run without a TikTok Shop live analytics dashboard is a stream where you're making decisions based on intuition instead of intelligence. Every week without systematic TikTok live commerce KPI tracking is a week where fixable problems go undetected and compounding opportunities go uncaptured.
You now have the blueprint. The question is whether you'll build it — and whether you'll build it fast enough.
Ready to skip the DIY phase and deploy enterprise-grade live commerce analytics from day one? Talk to a Strategist gives brands the proprietary data infrastructure, algorithmic creator matching, and full-stack live commerce strategy that turns TikTok Shop live from a guessing game into a growth engine. Book your free TikTok Shop growth audit at bemomentiq.com and see exactly how much revenue your live streams are leaving on the table — and the 90-day plan to capture it.
The brands building their analytics command centers today will own the live commerce category tomorrow. The only question is whether you'll be one of them.