TikTok Shop Content Analytics Decoded
Discover 11 TikTok Shop video performance signals that predict sales before they happen. Stop chasing views and start tracking metrics that drive real GMV.
You're staring at your TikTok Shop dashboard at 11 PM, watching a creator's video climb past 50K views — and feeling absolutely nothing. Because you've been here before. Big views. Tiny GMV. The video looked great, the product was front and center, the creator nailed the brief. But the cart button might as well have been invisible.
- Monitor video-level performance signals within the first 60 minutes of posting, since the algorithm decides your video's fate hours before sales data appears.
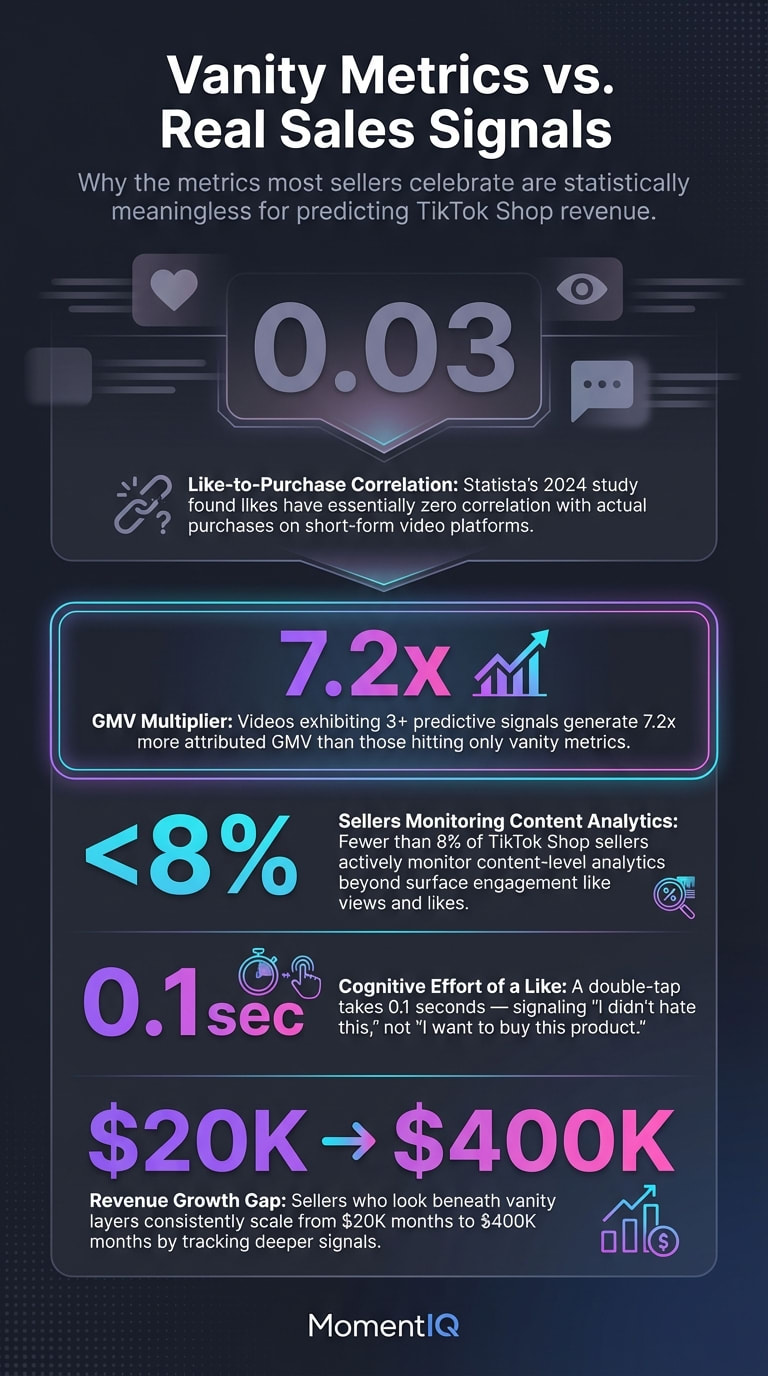
- Stop relying on views and likes as success indicators — like-to-purchase correlation on short-form video is just 0.03, essentially noise.
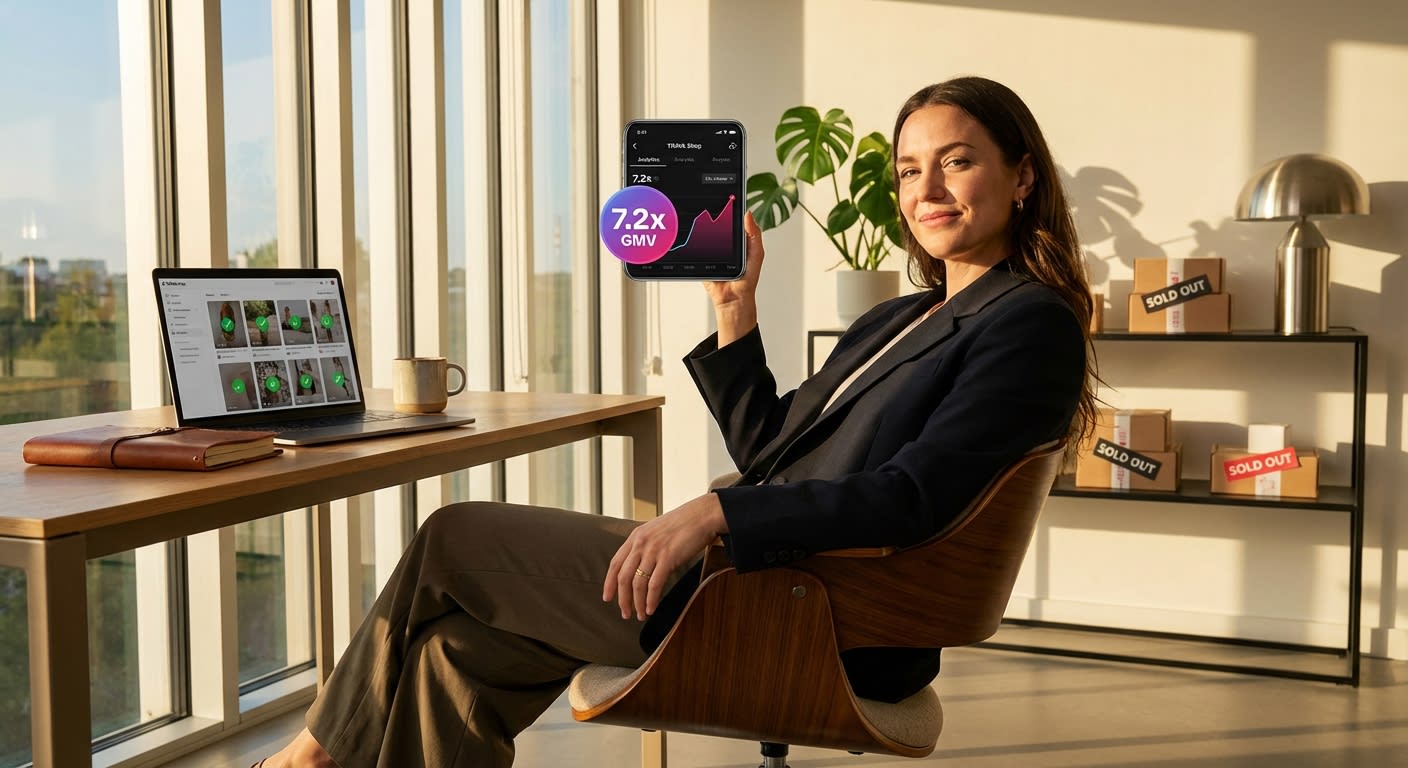
- Aim for three or more predictive content signals per video to unlock the 7.2x GMV multiplier over vanity-metric-only content.
- Analyze comment sentiment clusters and patterns rather than individual comments like 'OMG I need this' to gauge real purchase intent.
- Build or adopt real-time, video-specific analytics across your full creator portfolio — fewer than 8% of TikTok Shop sellers do this today.
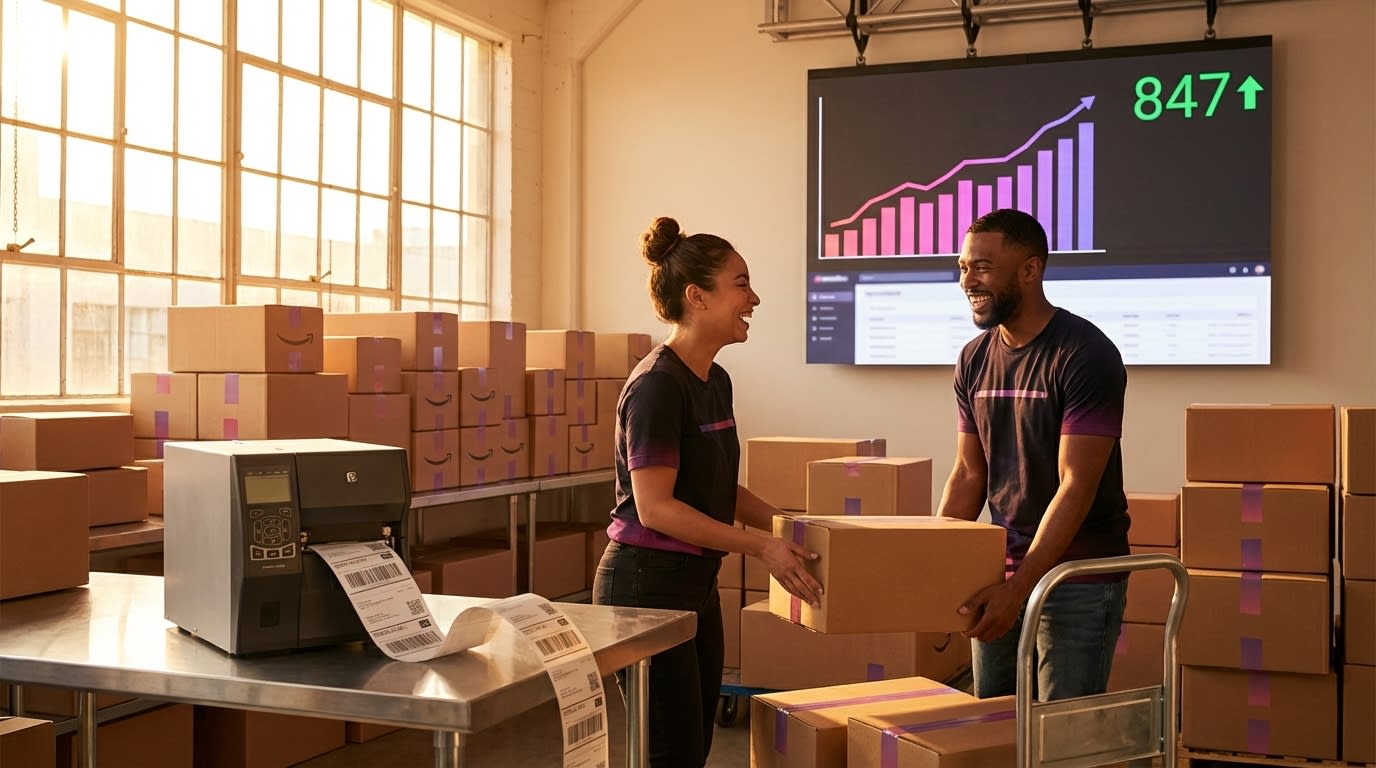
Here's what most TikTok Shop sellers get wrong: they wait for sales data to tell them what worked.By the time you see revenue numbers, the algorithm has already decided your video's fate — hours ago.The brands crushing it on TikTok Shop in 2025 aren't reacting to sales reports. They're reading content-level performance signals that predict purchases before a single transaction clears.
This isn't about shop-level KPIs like overall GMV, conversion rates, or ROAS dashboards. This is about the granular, video-specific TikTok Shop content analytics that tell you — within the first 60 minutes of a post going live — whether it's going to print money or burn budget.
According to TikTok's own 2024 Commerce Insights Report, videos that exhibit three or more of these predictive signals generate 7.2x more attributed GMV than videos that hit only vanity metrics like views and likes. Yet fewer than 8% of TikTok Shop sellers actively monitor content-level analytics beyond surface engagement.
That gap is your opportunity.Let's decode the 11 signals.
Why TikTok Video Performance Metrics Mislead Most Sellers

Before we get to the signals that matter, let's kill the ones that don't — or at least, the ones that don't mean what you think they mean.
Views are not demand. TikTok's algorithm pushes content based on initial engagement velocity, not purchase intent. A video can rack up 500K views because it's entertaining, controversial, or features a cute pet in the background — none of which correlate with someone clicking "Add to Cart."
Likes are not consideration. A double-tap takes 0.1 seconds of cognitive effort.It signals "I didn't hate this" — not "I want to buy this product." Statista's 2024 social commerce behavior study found that like-to-purchase correlation on short-form video platforms is just 0.03 — essentially noise.
Comments can be misleading. "OMG I need this!" sounds like intent. But without analyzing comment patterns and sentiment clusters, you're reading tea leaves.
The sellers who scale consistently — the ones going from $20K months to $400K months — have learned to look beneath these vanity layers. They're tracking *
TikTok content data for sales* that the algorithm itself uses to decide distribution.
And if you're thinking, "We don't have the bandwidth to analyze video-level signals across 200 creator posts a week" — you're right. That's exactly why brands partner with MomentIQ, where proprietary analytics tools decode these signals across your entire creator portfolio in real time. But more on that later. First, the signals themselves.
Signal #1: The Watch-Through Curve Shape (Not Just Average Watch Time)
Every TikTok Shop seller knows average watch time matters. But the shape of the watch-through curve matters exponentially more.
Here's the difference:
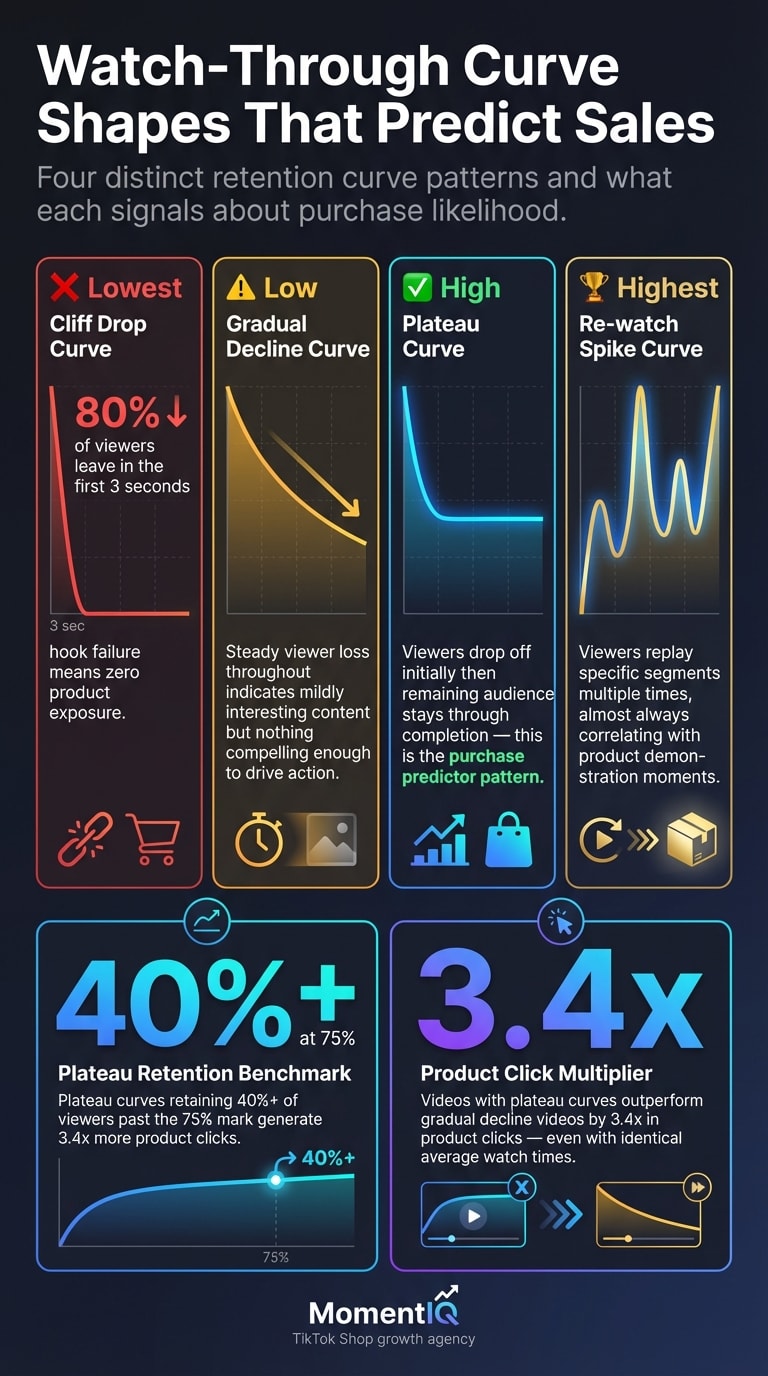
- Cliff drop curve: 80% of viewers leave in the first 3 seconds.Your hook failed. No amount of product placement at second 15 will save this.
- Gradual decline curve: Steady viewer loss throughout. Mildly interesting content, but nothing compels action.
- Plateau curve: Viewers drop off initially, then the remaining audience stays through completion. This is the purchase predictor. It means the people who stuck around are genuinely engaged — and engaged viewers convert.
- Re-watch spike curve: The holy grail. Viewers watch certain segments multiple times. This almost always correlates with product demonstration moments.
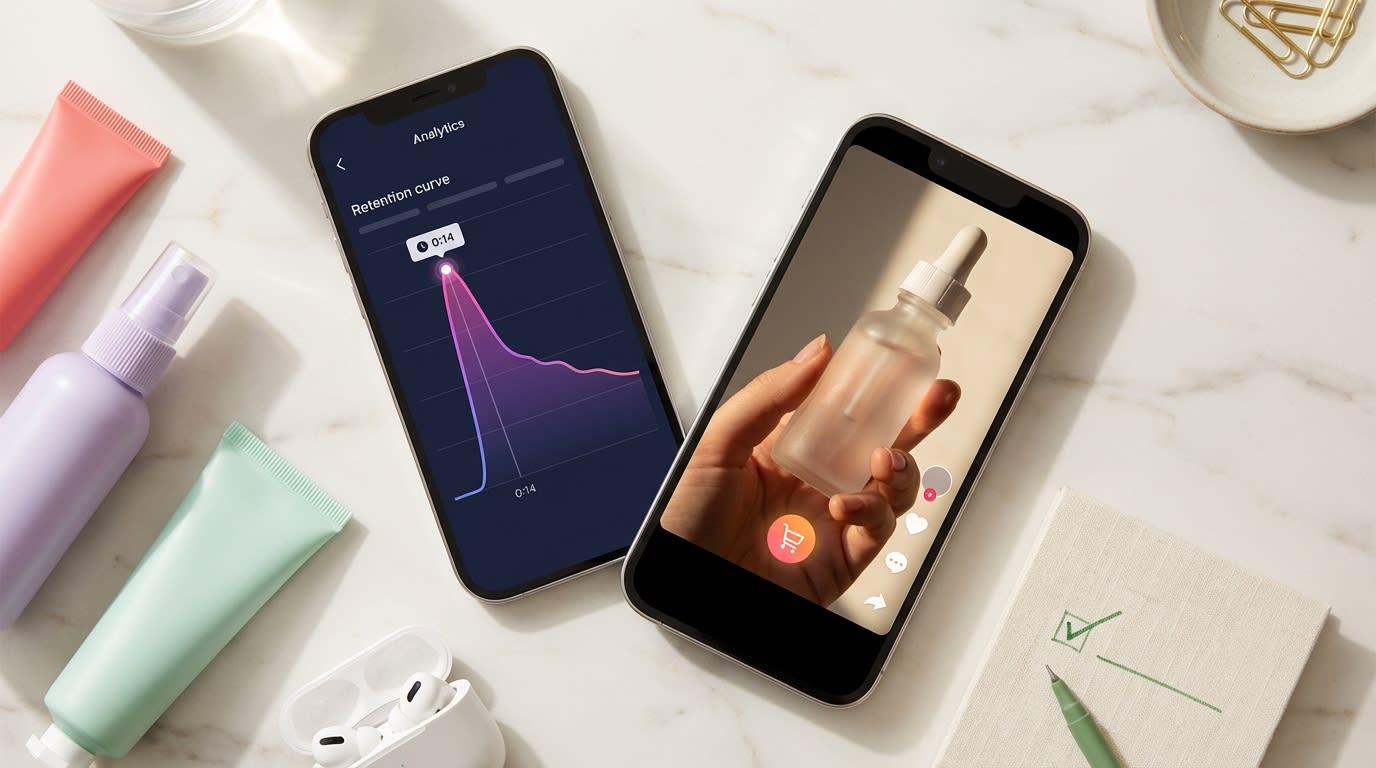
oded-11-video-performance-signals-that-predict--flat-lay-of-tablet-showing-tiktok-shop-v-b.jpg)
The predictive insight: Videos with a plateau curve that retains 40%+ of viewers past the 75% mark generate 3.4x more product clicks than videos with the same average watch time but a gradual decline shape, according to TikTok's creator commerce analytics benchmarks.
What to do: Stop optimizing for average watch time alone. Pull your TikTok analytics and look at the retention graph. If you see a plateau forming,immediately — before the organic window closes.
Signal #2: Share-to-Save Ratio — The Intent Decoder
Shares and saves are both "high-effort" engagement signals. But their ratio tells you something critical about why people are engaging.
- High shares, low saves: The content is entertaining or relatable, but the product isn't the star. People are sharing for social currency, not purchase intent.
- High saves, low shares: The viewer is bookmarking for later purchase consideration. This is a strong buy signal. They want the product but aren't ready to commit publicly.
- High shares AND high saves: Unicorn content. The product is both desirable and socially shareable. Scale this immediately.
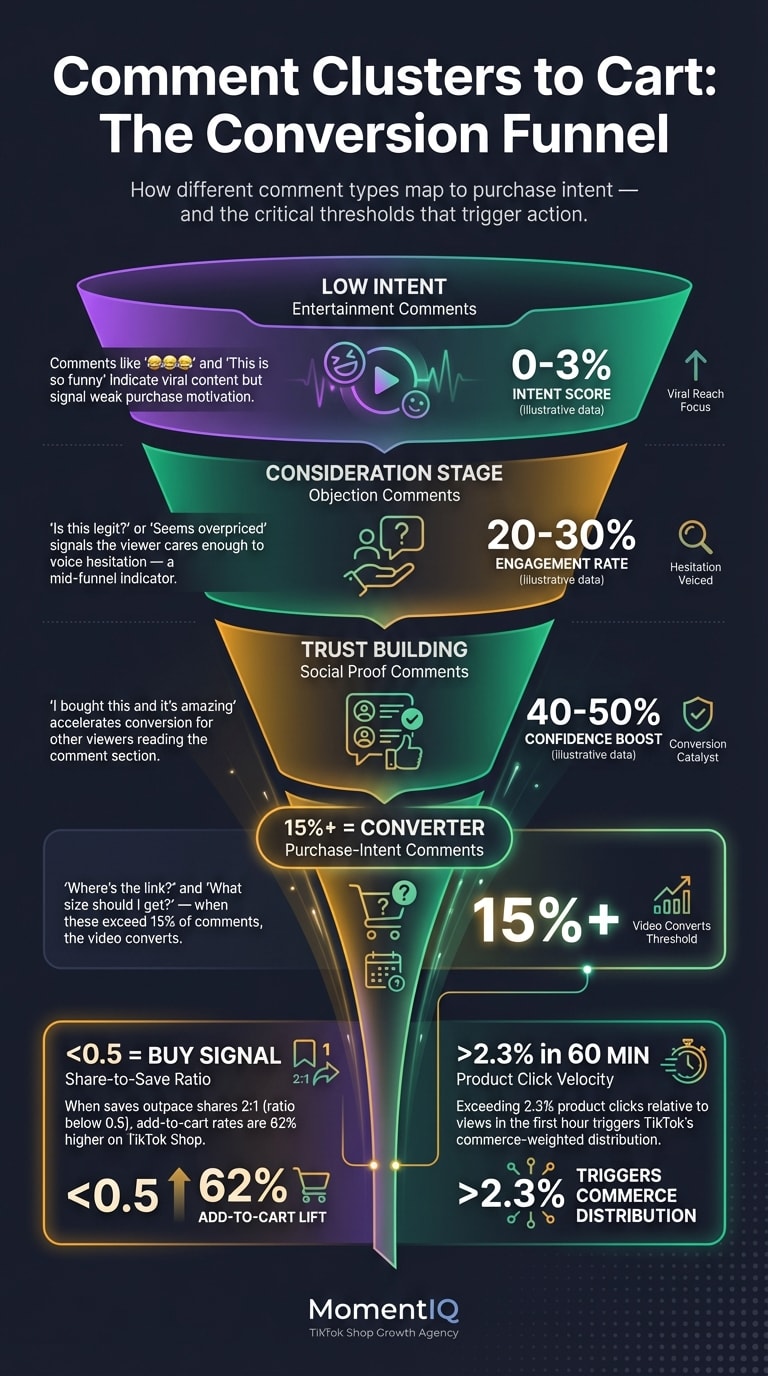
The benchmark: A share-to-save ratio below 0.5 (meaning saves outpace shares 2:1) correlates with 62% higher add-to-cart rates on TikTok Shop product pages, based on aggregated commerce data from Q4 2024.
Most sellers never even look at this ratio. They see "1,200 saves" and celebrate. But 1,200 saves with 2,400 shares is a fundamentally different signal than 1,200 saves with 300 shares. The second scenario is the one that predicts revenue.
Signal #3: Comment Sentiment Clusters That Predict Conversion
Forget counting comments. Start categorizing them.
After analyzing thousands of TikTok Shop videos, a clear pattern emerges. Comments cluster into predictive categories:
- Purchase-intent comments: "Where's the link?" "How much?" "What size should I get?" "Does this come in blue?" — These are pre-purchase signals. When these exceed 15% of total comments, the video is a converter.
- Social proof comments: "I bought this last week and it's amazing" "My friend has this" — These accelerate conversion for other viewers reading the comments.
- Objection comments: "Is this legit?" "Looks cheap" "Seems overpriced" — These aren't bad. They indicate consideration. The viewer cares enough to voice hesitation. If your product page and creator responses address these objections, conv
ersion follows.
- Entertainment comments: "😂😂😂" "This is so funny" "Not the cat in the background" — High volume of these with low purchase-intent comments? Your content is entertaining but not selling.
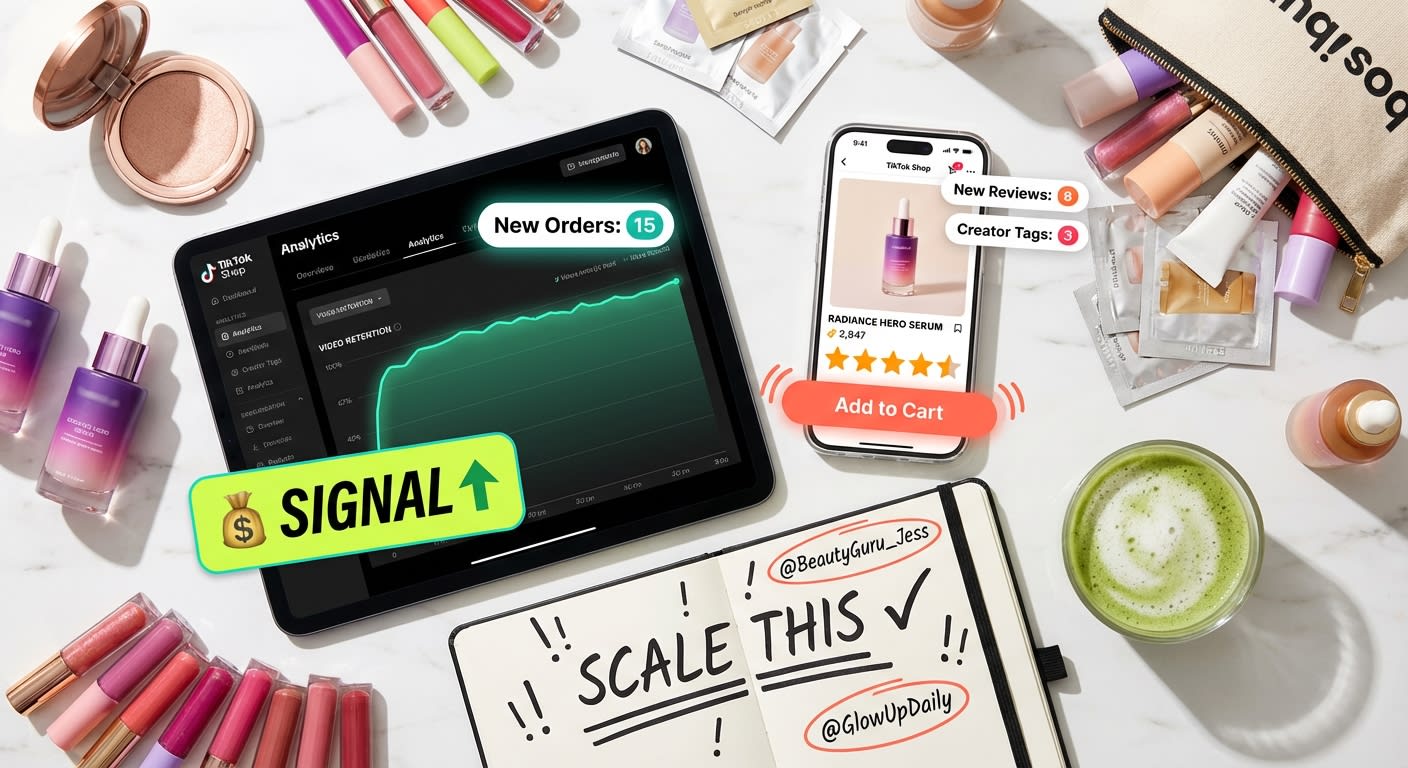
The action step: Within the first 2 hours of a video posting, scan the comment section. If purchase-intent comments represent 15%+ of total comments, that video deserves immediate paid amplification. Every hour you wait, the organic distribution window narrows.
Signal #4: Product Click Velocity in the First 60 Minutes
This is the most direct predictive signal — and the one most sellers check too late.
Product click velocity measures how quickly viewers tap the product link or shopping cart icon relative to the video's view count in its first hour of distribution.
Here's why the first 60 minutes matter: TikTok's algorithm makes its most consequential distribution decisions in this window. If a video generates product clicks at a rate above 2.3% of views in the first hour, TikTok's commerce algorithm recognizes it as a "shoppable" content piece and pushes it into commerce-weighted distribution pools — including the Shop tab and For You feeds of users with recent purchase behavior.
Miss that window, and no amount of boosting will replicate the organic commerce distribution you lost.
One home goods brand working with MomentIQ discovered that by monitoring product click velocity across their 150+ active creators, they could identify winning videos within 45 minutes of posting — and deploy Spark Ad budgets before competitors even noticed the content was performing. The result? A 340% increase in attributed GMV per creator video over 90 days.
Ready to stop guessing which content will convert? MomentIQ's proprietary analytics dashboard monitors these exact signals across your entire creator portfolio — in real time. Talk to a Strategist and see which of your videos are leaving money on the table.
Signal #5: Audio Completion Rate vs. Video Completion Rate
Here's a signal almost nobody talks about: the gap between audio completion and video completion rates.
TikTok tracks whether users are watching with sound on or off. When a video's audio completion rate significantly exceeds its video completion rate, it means viewers are listening while multitasking — the video is playing in the background, or they've scrolled past visually but the audio hook kept them.
Why does this matter for commerce?
Videos where audio completion exceeds video completion by 20%+ tend to be narrative-driven, testimonial-style content — exactly the format that builds trust and drives considered purchases. These videos may not look impressive on surface metrics (lower visual engagement), but they're doing deep persuasion work.
Conversely, videos where video completion far exceeds audio completion (people watching on mute) tend to be visually satisfying but lack the verbal persuasion needed to drive cart additions for products over $25.
The takeaway: For products requiring any level of purchase consideration, prioritize creators whose content has strong audio engagement. The "watch on mute" aesthetic trend works for awareness — not for sales.
Signal #6: Follower vs. Non-Follower Engagement Split
TikTok's analytics show you what percentage of a video's engagement comes from followers versus non-followers. This split is a critical commerce signal.
- 80%+ engagement from non-followers: The algorithm is distributing widely. Great for awareness, but these viewers have no relationship with the creator and convert at lower rates (typically 0.8-1.2% click-to-purchase).
- 50-70% engagement from non-followers: The sweet spot. Enough algorithmic distribution to drive scale, with enough follower-base trust to drive conversion (typically 2.1-3.4% click-to-purchase).
- 80%+ engagement from followers: The algorithm isn't pushing this beyond the creator's existing audience. Limited scale potential, but high conversion among those who see it.
The strategic implication: When you see a creator's video hitting the 50-70% non-follower engagement range with strong product click velocity, you've found a scalable commerce content format. Replicate it. Brief other creators to follow the same structure.
Signal #7: The "Second Watch" Indicator
TikTok tracks replay behavior, and it's one of the strongest algorithmic quality signals. But for commerce specifically, what matters is where viewers replay.
If viewers are replaying the first 3 seconds, your hook is confusing — they're trying to understand what they just saw. That's not a buy signal.
If viewers are replaying the product demonstration segment (typically seconds 8-20 in a 30-second video), that's active purchase consideration. They're studying the product. They're imagining themselves using it. They're looking for details that will tip them toward buying.
eMarketer's 2024 social commerce report found that product demonstration replays are the single strongest predictor of same-session purchase, outperforming even direct product clicks in predictive accuracy. Why? Because a replay represents unprompted interest — the viewer chose to see the product again without being asked.
Signal #8: Stitch and Duet Response Volume
When other creators stitch or duet your product video, something powerful is happening: organic social proof is compounding without you spending a dollar.
But more importantly, stitch/duet volume is a leading indicator of viral commerce potential. Videos that generate 10+ stitches within 48 hours of posting historically precede a 5-8x GMV spike in the following week — because each stitch creates a new entry point into your product's ecosystem.
The signal to watch: Track not just the volume of stitches and duets, but the sentiment of them. Are creators stitching to agree ("I tried this and it's actually amazing")? That's a multiplier. Are they stitching to challenge ("There's no way this works")? That's still valuable — controversy drives curiosity clicks, and curiosity clicks convert at 1.8x the rate of passive discovery clicks.
This is also where having a massive creator network pays dividends. When you're seeding products to 200-500 creators simultaneously — as brands do through MomentIQ's managed product seeding programs — the probability of triggering organic stitch/duet chains increases exponentially.
Signal #9: Profile Visit Rate After Video View
This signal is counterintuitive. When a viewer watches a product video and then visits the creator's profile, it suggests one of two things:
- They want to verify the creator's credibility before purchasing (trust-building behavior)
- They want to find more content about the product (deep consideration behavior)
Both are strong purchase precursors.
A profile visit rate above 3.5% on a commerce video is exceptional and typically precedes conversion rates 2x above the creator's average. It means the content created enough interest that viewers are actively seeking more information — the digital equivalent of picking up a product in a store and turning it over to read the back label.
When you see this signal, it's also an indicator that the creator's profile should be optimized for commerce: pinned product videos, a clear shop link, and a bio that reinforces credibility. Most creators don't do this by default — which is why managed creator programs that handle profile optimization alongside content strategy consistently outperform DIY approaches.
Signal #10: Time-of-Day Engagement Quality Variance
The same video posted at different times doesn't just get different view counts — it gets different quality of engagement. And engagement quality directly predicts sales.
Here's what the data shows:
- Morning posts (6-9 AM): Higher save rates, lower share rates. Viewers are in "planning" mode — bookmarking for later purchase.
- Midday posts (11 AM-2 PM): Highest product click rates. Lunch-break browsing converts because viewers have time to complete purchases.
- Evening posts (7-10 PM): Highest view counts and shares, but lower product click-through rates. Entertainment mode dominates.
- Late night posts (10 PM-1 AM): Surprisingly strong conversion rates for impulse purchases under $30. Lower volume, higher intent.
The predictive application: Don't just look at what engagement a video gets — look at when that engagement peaks. A video that generates its highest product click velocity during the 11 AM-2 PM window, regardless of when it was posted, is signaling genuine purchase intent from an audience in buying mode.
Here's the uncomfortable truth: Manually tracking these 10 signals across even 50 creator videos per week is a full-time job. Tracking them across 500+ creator posts? Impossible without proprietary analytics infrastructure. That's exactly what MomentIQ built. Talk to a Strategist to see how algorithmic content analysis can transform your TikTok Shop performance.
Signal #11: The "Silent Converter" Pattern — Low Engagement, High Sales

This is the signal that breaks most sellers' brains: some of the highest-converting TikTok Shop videos have mediocre engagement metrics.
Low likes. Few comments. Modest view counts. But disproportionately high product clicks and purchases.
We call these "silent converters," and they share common characteristics:
- Direct, no-nonsense product demonstrations without entertainment hooks
- Specific problem-solution framing ("If you have [exact problem], this fixes it")
- Creator speaking directly to camera in a conversational, almost private tone
- No trending audio — original sound only
These videos don't go viral because they're not designed to entertain the masses. They're designed to convert the specific person who has the problem the product solves. TikTok's algorithm shows them to smaller, highly targeted audiences — and those audiences buy.
The critical mistake: Most sellers (and most generic agencies) would kill these videos. They'd see 8K views and 43 likes and tell the creator to "make it more engaging." Meanwhile, that "boring" video generated $4,200 in attributed sales at a 6.8% conversion rate.
This is why TikTok Shop content analytics require a fundamentally different evaluation framework than standard social media metrics. And it's why brands that try to manage creator content strategy with Instagram-era thinking consistently underperform.
How to Build a Predictive Content Analytics System (Without Losing Your Mind)

Knowing these 11 signals is step one. Operationalizing them across a scaled creator program is where most brands hit a wall.
Here's what a functional TikTok Shop content analytics system requires:
The Data Layer
- Real-time access to video-level analytics across every creator posting about your product (not just your own account)
- Automated signal detection that flags videos hitting predictive thresholds within the first 60 minutes
- Historical pattern matching that compares new video signals against your top-performing content library
The Decision Layer
- Amplification triggers: Pre-set rules for when to deploy Spark Ad budget based on signal combinations
- Creator feedback loops: Data-driven briefs that tell creators "your last video's product demo segment had 3.2x replay rate — lead with that format next time"
- Kill switches: Equally important — knowing when to not amplify a video that looks good on surface metrics but lacks commerce signals
The Scale Layer

- Cross-creator pattern analysis: Which content formats, hooks, and demonstration styles consistently produce purchase-predictive signals across your entire creator roster?
- Algorithmic creator matching: Using performance signal data to identify new creators whose content style matches your highest-converting patterns

This is where the "we can manage creators ourselves" objection falls apart. A brand with 5-10 creators can probably eyeball these signals manually. But TikTok Shop rewards volume. The platform's own data shows that brands with 100+ active affiliates generate 11x more GMV than brands with fewer than 20. And at 100+ creators producing 3-5 videos per week each, you're looking at 300-500 pieces of content to analyze every single week.
No spreadsheet survives that. No intern survives that. You need infrastructure.
The Cost of Ignoring Content-Level Analytics

Let's do some math that should make you uncomfortable.
Assume you have 80 active creators posting an average of 3 videos per week. That's 240 videos per week, roughly 1,000 per month.
Industry data suggests that the top 8-12% of TikTok Shop creator videos drive 70-80% of total attributed GMV. That means roughly 80-120 of your monthly videos are potential revenue drivers — and the rest are noise.
Without predictive content analytics, you're:
- Missing the amplification window on 60-70% of your top-performing videos (they peak organically and die before you notice)
- Wasting Spark Ad budget on videos that look good but lack commerce signals (the average seller misallocates 40-55% of their amplification spend on non-converting content)
- Giving wrong feedback to creators because you're evaluating their content on entertainment metrics, not commerce metrics
- Leaving $50K-$200K/month on the table depending on your scale — revenue that was right there in content that was already posted but never properly identified and amplified
One supplement brand came to MomentIQ after 8 months of stagnant TikTok Shop performance. They had 120 active creators and were generating $18K/month in GMV. The content wasn't the problem — they had dozens of silent converters buried in their creator feed that nobody had identified. Within 90 days of implementing MomentIQ's content analytics system and algorithmic creator matching, they scaled to $420K/month. Same product. Same price point. Radically different content intelligence.
Why Generic Agencies and In-House Teams Miss These Signals
Let's address the elephant in the room.
"We've tried agencies before and they didn't move the needle."
We hear this constantly. And honestly? Most agencies don't move the needle on TikTok Shop — because they're applying influencer marketing frameworks to a commerce platform. They optimize for reach, impressions, and engagement rate. They send creators briefs focused on "brand awareness." They report on vanity metrics and call it strategy.
TikTok Shop is not an awareness channel. It's a sales channel with an entertainment wrapper. The analytics that matter are commerce analytics — product click velocity, watch-through curve shapes, share-to-save ratios, comment sentiment clusters. Generic influencer agencies don't track these because they don't understand TikTok Shop's unique mechanics.
In-house teams face a different problem: they understand the platform but can't scale the analysis. Your TikTok Shop manager is already juggling inventory, customer service, creator communications, and ad management. Asking them to also perform granular content analytics across hundreds of videos per week is a recipe for burnout and missed opportunities.
This is precisely why MomentIQ exists as a TikTok-native commerce partner — not a generic influencer agency that bolted on a TikTok offering. As TikTok Shop Partner of the Year and a certified TikTok Marketing Partner, MomentIQ's entire infrastructure is built around the commerce signals that predict and drive sales. From algorithmic creator matching through the Reacher platform to real-time content performance monitoring, every system is designed for one outcome: scalable, predictable GMV growth.
The Window Is Narrowing — And the Data Proves It

Here's the urgency most sellers aren't feeling yet but should be:
TikTok Shop's U.S. GMV grew over 200% year-over-year in 2024, according to industry estimates compiled by eMarketer. The platform is projected to capture $17.5 billion in U.S. social commerce sales by 2026 (Statista, 2024). But early-mover advantages on algorithmic platforms don't last forever.
The brands building content analytics infrastructure now are creating compounding advantages that latecomers can't replicate:
- Historical performance data that trains better predictive models over time
- Creator relationships locked in before competition drives up commission rates
- Algorithmic trust built through consistent commerce signals that TikTok's system rewards with preferential distribution
- Content pattern libraries that make every new creator brief more effective than the last
Every month you spend guessing which content converts is a month your competitors spend learning. And on an algorithmic platform, learning compounds. The gap between brands with content analytics infrastructure and brands without it doesn't stay constant — it widens exponentially.
A beauty brand that partnered with MomentIQ in early 2024 now has 14 months of content signal data across 300+ creators. Their predictive model identifies winning videos with 84% accuracy within 45 minutes of posting. A competitor entering the same category today starts at zero. That's not a gap you close with a bigger ad budget. That's a gap you close by starting now.
Turning Signals Into Sales: Your Next Steps
You now understand the 11 content-level signals that predict TikTok Shop sales before they happen. The question is: what are you going to do with this knowledge?
Option A: Try to build this analytics capability in-house. Hire a data analyst. Build custom dashboards. Spend 6 months iterating on a system that still can't match creators algorithmically or monitor 500+ videos per week in real time. Hope your competitors don't scale faster while you're building.
Option B: Partner with the team that already built it.
MomentIQ has spent years engineering the exact content analytics infrastructure described in this article — plus the creator matching, product seeding, and full-funnel commerce strategy that turns data insights into revenue growth. As TikTok Shop Partner of the Year, we don't just read the signals. We've helped define what the signals mean.
Here's what a partnership looks like:
- Week 1: Full audit of your current content performance, creator portfolio, and missed revenue opportunities
- Week 2-4: Algorithmic creator matching to fill gaps in your content strategy, managed product seeding at scale
- Ongoing: Real-time content signal monitoring, automated amplification triggers, data-driven creator briefs, and monthly strategy optimization
The brands that will dominate TikTok Shop in 2025 and beyond aren't the ones with the biggest budgets. They're the ones with the best content intelligence.
See your custom TikTok Shop scaling roadmap — built on the exact content analytics framework in this article. Book your free growth audit with MomentIQ at bemomentiq.com before your competitors read this same post and get there first.
MomentIQ is a certified TikTok Marketing Partner and TikTok Shop Partner of the Year, specializing in algorithmic creator matching, product seeding at scale, and full-funnel TikTok commerce strategy. Learn more at bemomentiq.com.