The Ultimate TikTok Shop Creator Performance Dashboard
Discover 9 custom TikTok Shop creator performance reports to track, score, and scale your top revenue-driving affiliates. Stop guessing and start optimizing.
You have 200 creators in your affiliate program. Maybe 500. Maybe more.
- Build a weighted creator scorecard that factors in commission rates and true profitability, not just raw GMV numbers.
- Track content decay curves per creator to stop seeding product to partners whose video performance has already peaked.
- Set up automated dormancy tracking to identify and reactivate high-performing creators who've gone silent after 60 days.
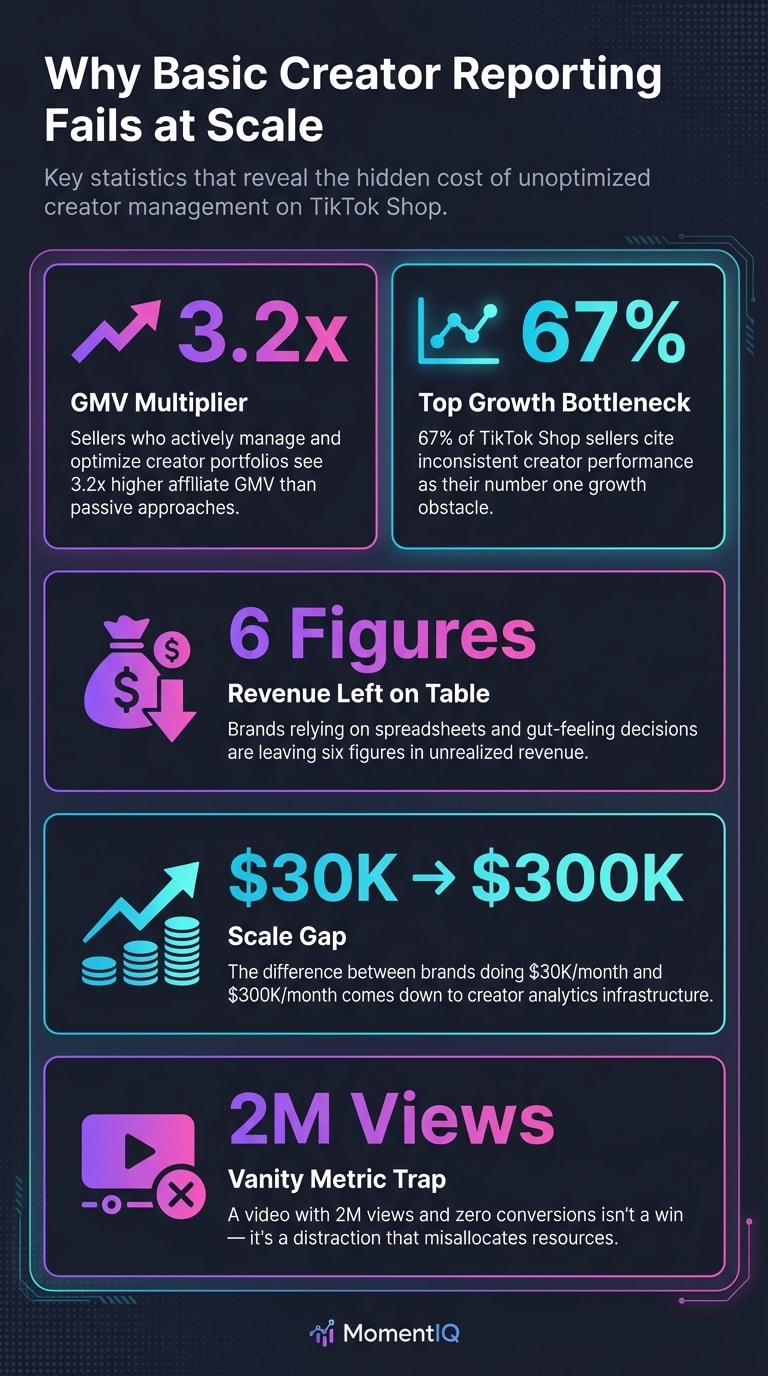
- Stop celebrating vanity metrics — a 2M-view video with zero conversions is a distraction, not a win.
- Actively manage your creator portfolio to achieve the 3.2x higher affiliate GMV that optimized programs see over passive approaches.
But here's the question that keeps TikTok Shop sellers up at night: which of those creators are actually making you money which creators actually drive sales — and which are silently draining your margins?

If you're still tracking TikTok Shop creator performance in spreadsheets, copying data from Seller Center tabs, and "gut-feeling" your way through creator reinvestment decisions, you're leaving six figures on the table.That's not hyperbole.That's math we'll walk through below.
This guide isn't about the 15 metrics you should watch (we've already covered that in our TikTok Shop Analytics deep-dive).This is about building a custom creator performance scoring system — the kind of infrastructure that tells you exactly which creators to double down on, which to reactivate, and which to sunset. Weighted scorecards. Cohort-based revenue attribution. Content decay curves. Reactivation triggers.
The kind of TikTok Shop creator analytics dashboard that separates brands doing $30K/month from brands doing $300K/month.
Let's build it.
Why Basic TikTok Shop Creator Reporting Fails at Scale
TikTok's Seller Center gives you surface-level affiliate data. Views, clicks, orders, GMV by creator. It's a start — but it's not a system.
Here's what breaks when you try to scale with basic reporting:
- You can't rank creators by true profitability. A creator driving $10K GMV at a 20% commission rate is less profitable than one driving $6K at 8%. Basic dashboards don't weight for margin.
- You miss content decay. A creator's first video might generate $5K. Their fourth video? $400. Without tracking performance curves over time, you keep seeding product to creators whose content has already peaked.
- You can't identify reactivation opportunities. Some of your best-performing creators from 60 days ago have gone silent.They're not lost — they just need a trigger. But you'd never know without automated dormancy tracking.- You over-index on vanity metrics. A video with 2M views and zero conversions isn't a win. It's a distraction. Yet most sellers celebrate it.

According to TikTok's own Commerce Insights report, sellers who actively manage and optimize their creator portfolios see 3.2x higher affiliate GMV than those who take a "post and pray" approach. And a 2024 Statista analysis found that 67% of TikTok Shop sellers cite inconsistent creator performance as their top growth bottleneck.
The problem isn't that you don't have enough creators.It's that you don't have the infrastructure to know what your creators are actually doing for your bottom line.
That's exactly the gap a custom TikTok Shop creator analytics dashboard fills.

Still managing creator performance in spreadsheets? Talk to a Strategist and see how our proprietary dashboards replace guesswork with real-time, revenue-weighted creator intelligence. The brands scaling fastest aren't working harder — they're seeing clearer.
The Creator Performance Scoring Framework: How to Weight What Actually Matters
Before we dive into the nine reports, you need a scoring framework. Think of this as the operating system that powers every dashboard you build.
Building a Weighted Creator Scorecard
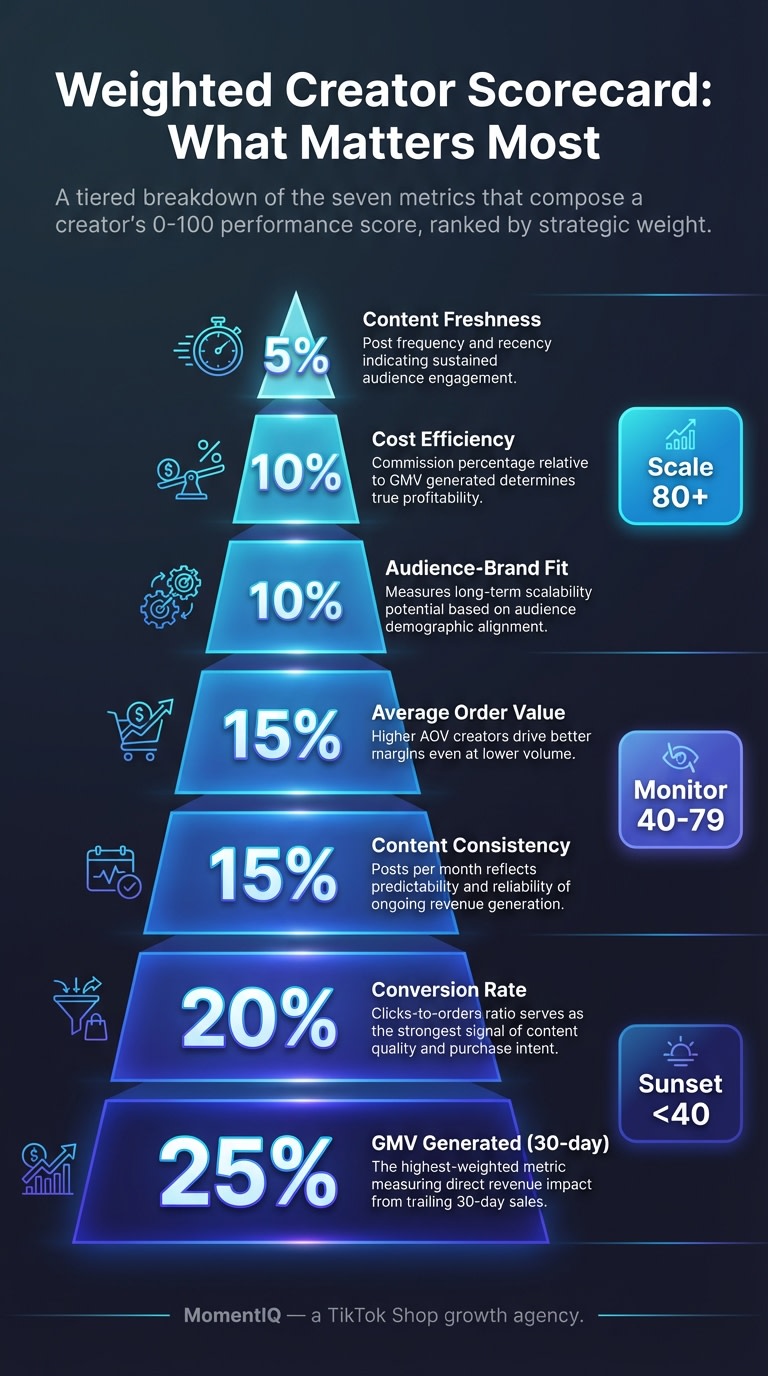
Not all metrics are created equal. A creator's value to your brand is a composite score, not a single number.Here's a weighted scorecard framework that top-performing TikTok Shop brands use:
| Metric | Weight | Why It Matters |
|---|---|---|
| GMV Generated (trailing 30 days) | 25% | Direct revenue impact |
| Conversion Rate (clicks → orders) | 20% | Content quality signal |
| Content Consistency (posts/month) | 15% | Predictability of revenue |
| Average Order Value Driven | 15% | Margin impact |
| Audience-Brand Fit Score | 10% | Long-term scalability |
| Cost Efficiency (commission % vs. GMV) | 10% | Profitability |
| Content Freshness (days since last post) | 5% | Engagement trajectory |

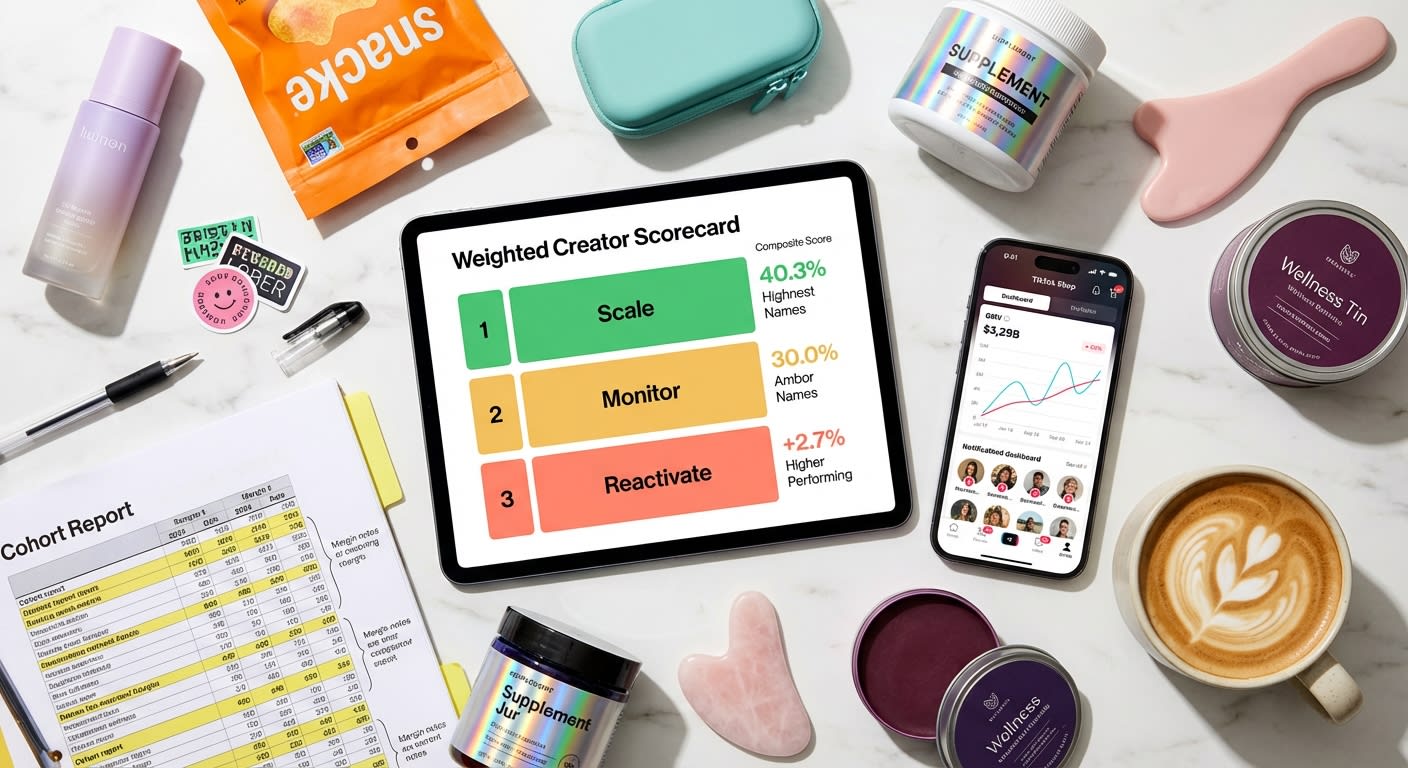
Each creator gets a composite score from 0-100. Creators scoring 80+ are your "Scale" tier — increase seeding, offer exclusives, raise commission. Creators scoring 40-79 are "Monitor" tier.Below 40? Time for a reactivation campaign or a sunset conversation.
This isn't theoretical.One home goods brand implemented this exact scorecard through MomentIQ's analytics infrastructure and reduced their creator roster by 35% while increasing affiliate GMV by 58% in a single quarter. Fewer creators, more revenue. That's the power of scoring.

Report #1: The Revenue Attribution Cohort Report

How to Track TikTok Shop Creator Performance by Acquisition Cohort
Most sellers look at creator performance as a snapshot. That's a mistake. You need to see performance by cohort — grouping creators by when they joined your program.
Why? Because it answers critical questions:
- Are the creators you onboarded last month performing better or worse than those from three months ago?
- Is your creator recruitment quality improving or declining?
- Which onboarding cohort has the highest lifetime GMV per creator?
How to build it:
- Group creators by the month they made their first sale
- Track cumulative GMV per cohort over 30, 60, and 90-day windows
- Calculate average GMV per creator within each cohort
- Overlay your recruitment source (organic application, outreach via Reacher, paid placement) to identify which sourcing channels produce the highest-value creators
The insight: If your Q1 cohort averages $2,800/creator/month but your Q2 cohort averages $900, your recruitment strategy has regressed. Fix it before you waste another month of product seeding.
Report #2: The Content Decay Curve
Mapping When Creator Content Stops Converting

Every piece of TikTok Shop content has a revenue half-life. The content decay curve tracks how quickly a creator's videos lose their conversion power after posting.

According to eMarketer's 2024 social commerce analysis, the average TikTok Shop video generates 72% of its total GMV within the first 48 hours. But that's an average — and averages lie.
Some creators produce "evergreen converters" — content that TikTok's algorithm resurfaces for weeks, generating steady sales. Others produce "spike-and-die" content that burns bright and vanishes.
How to build it:
- For each creator, track daily GMV per video for 14 days post-publish
- Plot the decay curve (Day 1 GMV, Day 2, Day 3... Day 14)
- Classify creators into three archetypes:
- Evergreen Producers: Less than 50% decay by Day 7 (rare and incredibly valuable)
- Standard Performers: 60-80% decay by Day 7 (most creators)
- Flash Performers: 90%+ decay by Day 48 (high initial impact, low durability)
The insight: Flash Performers aren't bad — they're just different. Use them for product launches and tentpole moments. Invest your ongoing seeding budget in Evergreen Producers. This single distinction can improve your content ROI by 40-60%.

Report #3: The Profitability Matrix
Creator-Level P&L Beyond GMV
Here's what most sellers get wrong: they optimize for GMV when they should be optimizing for profit per creator.
A creator generating $20K GMV at a 20% commission rate with a 15% product COGS and $500 in seeding costs is delivering a very different return than a creator generating $8K GMV at an 8% commission rate with the same COGS.

How to build it:
For each creator, calculate:
- Gross GMV (total sales attributed)
- Commission paid (flat rate or tiered)
- Product seeding cost (COGS of samples sent)
- Incremental shipping/fulfillment costs
- Net Creator Profit = GMV - COGS - Commission - Seeding - Fulfillment
- Creator ROAS = Net Creator Profit / Total Creator Investment
The insight: When one supplement brand ran this analysis through MomentIQ's analytics layer, they discovered that their top GMV creator was actually their 7th most profitable creator. Their most profitable creator? A micro-creator with 45K followers who converted at 3x the rate with an 8% commission. They tripled that creator's product allocation and saw a $67K monthly profit increase.
This is why tracking TikTok Shop creator performance without a profitability lens is like driving with your dashboard lights off.
Report #4: The Reactivation Trigger Dashboard
Automated Alerts for Dormant High-Value Creators
Creator ghosting is one of the most expensive problems in TikTok Shop affiliate management. Industry data suggests that 40-55% of active affiliate creators go dormant within 60 days of their first post (TikTok Commerce, 2024).
But here's what most sellers miss: dormant doesn't mean dead.
How to build it:
- Flag any creator who scored 60+ on your weighted scorecard but hasn't posted in 14+ days
- Categorize dormancy reasons:
- Product exhaustion (they ran out of samples — easy fix)
- Content fatigue (they need a new angle or brief)
- Competitive poaching (a competitor offered higher commission)
- Platform shift (they moved focus to Instagram or YouTube)
- Set automated reactivation triggers:
- Day 14: Personalized DM with new product drop or content brief
- Day 21: Commission bump offer (temporary or permanent)
- Day 30: New product seeding with exclusive early access
- Day 45: Final outreach before sunset
The insight: Reactivating a proven creator is 5-8x more cost-efficient than recruiting and onboarding a new one. Your dormant creator list isn't a dead list — it's your highest-ROI opportunity.

Report #5: The Content-to-Conversion Gap Analysis
Identifying Where Creator Content Leaks Revenue
A creator's video gets 500K views and 12,000 clicks. But only 47 orders.
That's a 0.39% click-to-order rate. Something is broken — but what?

How to build it:
Track the full funnel for each creator's content:
- View → Click Rate (measures hook and CTA strength)
- Click → Add to Cart Rate (measures product page alignment)
- Cart → Purchase Rate (measures pricing/trust/checkout friction)
- Benchmark each creator against your program average
Common gap patterns:
- High views, low clicks: Creator content entertains but doesn't drive action. They need stronger CTAs or product integration.
- High clicks, low carts: Your product listing doesn't match the creator's pitch. Misaligned expectations = abandoned clicks.
- High carts, low purchases: Pricing friction, shipping costs, or checkout issues. This isn't a creator problem — it's a listing problem.
The insight: This report prevents you from blaming creators for problems that live in your product listings, pricing, or checkout flow. Roughly 30% of "underperforming" creators are actually driving qualified traffic to broken funnels (MomentIQ internal benchmarking across 500+ brand programs).

Want to see where your creator funnel is leaking revenue? Talk to a Strategist and get a custom content-to-conversion gap analysis for your top 20 creators. Our team has optimized creator funnels for brands generating $50K to $2M+/month on TikTok Shop.
Report #6: The Creator Velocity Index
Measuring Momentum, Not Just Performance
Static performance data tells you where a creator is. Velocity data tells you where they're going.
The Creator Velocity Index tracks the rate of change in a creator's key metrics over rolling 30-day windows.

How to build it:
- Calculate month-over-month growth rates for each creator across:
- GMV
- Conversion rate
- Content frequency
- Average views per video
- Assign a velocity score: Accelerating (positive trajectory), Stable (flat), or Decelerating (negative trajectory)
Why this matters:
A creator generating $3K/month with a 40% month-over-month growth rate is more valuable than a creator generating $8K/month with a -15% decline. The accelerating creator will surpass the decelerating one within 60-90 days — but only if you invest in them now.
Brands that identify and invest in accelerating creators early capture what we call the "momentum premium" — the compounding advantage of backing creators before their rates increase and competitors notice them.

Report #7: The Commission Efficiency Report
Optimizing Your Affiliate Rate Structure by Creator Tier
According to a 2024 analysis of TikTok Shop affiliate programs, the average commission rate across all categories is 15-20%. But averages are dangerous.
How to build it:
- Plot each creator on a scatter chart: X-axis = commission rate, Y-axis = GMV generated
- Identify four quadrants:
- High GMV, Low Commission: Your unicorns. Protect them. Consider proactive rate increases to lock in loyalty before competitors poach them.
- High GMV, High Commission: Profitable if margins support it. Monitor closely.
- Low GMV, Low Commission: Low risk, low reward. Test with new products or briefs before sunsetting.
- Low GMV, High Commission: Your margin killers. Renegotiate or sunset immediately.

The insight: One beauty brand discovered they were paying 22% commission to 34 creators who collectively generated less GMV than a single creator earning 10%. Restructuring their commission tiers freed up $14K/month in margin that they reinvested into product seeding for their top performers.
Report #8: The Cross-Product Performance Map
Which Creators Sell Which Products Best
Not every creator converts equally across your catalog. A creator who crushes it with your $29 serum might completely flop with your $89 bundle.

How to build it:
- Create a matrix: creators on one axis, products/SKUs on the other
- Fill each cell with conversion rate and GMV
- Identify creator-product "sweet spots" — the combinations that dramatically outperform
The insight: This report transforms your seeding strategy from "send everything to everyone" to precision-matched product-creator pairings. When you send the right product to the right creator, conversion rates typically jump 2-4x.
This is one of the core advantages of MomentIQ's algorithmic creator matching system — it doesn't just match creators to brands. It matches creators to specific SKUs based on historical performance data, audience demographics, and content style analysis. It's the difference between a shotgun and a sniper rifle.

Report #9: The Portfolio Risk & Concentration Report
How Exposed Is Your Revenue to Creator Churn?
Here's a stat that should make every TikTok Shop seller uncomfortable: if your top 3 creators generate more than 40% of your affiliate GMV, your program has a concentration risk that could wipe out growth overnight.
Creators get banned. They switch platforms. They get poached by competitors offering 25% commission. They simply lose interest.

How to build it:
- Calculate the percentage of total affiliate GMV contributed by your top 1, 3, 5, 10, and 20 creators
- Set risk thresholds:
- Top 3 creators > 50% of GMV: Critical risk. Diversify immediately.
- Top 3 creators = 30-50% of GMV: Moderate risk. Actively recruit and develop mid-tier creators.
- Top 3 creators < 30% of GMV: Healthy distribution. Maintain and optimize.
- Run a "what-if" scenario: if your #1 creator stopped posting tomorrow, what happens to your monthly GMV?
The insight: Portfolio diversification isn't just a finance concept. It's a survival strategy for TikTok Shop. The brands that scale sustainably to $500K+/month typically have no single creator contributing more than 8-12% of total affiliate GMV.
Why Spreadsheets Can't Do This (And What Replaces Them)
Let's address the elephant in the room.
"We can build this ourselves in Google Sheets."
Can you? Let's be honest about what that looks like:
- Manually exporting data from Seller Center daily (or weekly, if you're being realistic)
- Copy-pasting into spreadsheets that break when column formats change
- Spending 8-12 hours per week on data hygiene instead of strategy
- No real-time alerts, no automated scoring, no decay curve tracking
- Data that's always 3-7 days old — an eternity in TikTok's algorithmic cycle
A 2024 survey by Forrester found that e-commerce teams spend an average of 23% of their time on manual data aggregation — time that directly competes with strategy, creator relationship management, and growth initiatives.
At 100 creators, spreadsheets are painful. At 500, they're impossible. At 1,000+, you're not managing a program — you're managing a spreadsheet.
"We've tried agencies before and they didn't deliver."
Most agencies don't build infrastructure. They run campaigns. There's a massive difference.
Campaign-focused agencies give you a burst of creator content, a report at the end of the month, and a renewal pitch. They don't build the analytical systems that compound over time.
MomentIQ operates differently. As TikTok Shop Partner of the Year and a certified TikTok Marketing Partner, MomentIQ builds the data layer that sits underneath your entire creator program — real-time dashboards, automated scoring, algorithmic creator matching through the Reacher platform, and the strategic layer that turns data into decisions.
"We don't have the budget for an agency."
Let's run the math. If you're managing 200+ creators manually:
- 1 full-time creator manager: $55-75K/year salary + benefits
- Data tools and subscriptions: $500-2,000/month
- Opportunity cost of suboptimal creator allocation: conservatively 20-40% of your current affiliate GMV
If your program generates $100K/month in affiliate GMV, a 30% optimization improvement is worth $30K/month — $360K/year. That's not a cost. That's a multiplier.
One fitness equipment brand partnered with MomentIQ and scaled from $22K to $310K/month in affiliate GMV within 120 days — primarily by implementing the scoring and reactivation systems described in this guide. Their total investment was a fraction of the incremental revenue generated.
The Compounding Cost of Waiting
TikTok Shop's U.S. GMV grew over 200% year-over-year in 2024, according to TikTok's commerce division. eMarketer projects TikTok will capture $17.5 billion in U.S. social commerce sales by 2026.
But here's what the projections don't tell you: the brands building creator analytics infrastructure now are creating competitive moats that late entrants can't replicate.
Why? Because:
- Creator relationships compound. The brands that identify, invest in, and retain top creators today lock them into long-term partnerships. When your competitor shows up in 6 months, those creators are already loyal — and more expensive to poach.
- Algorithmic data compounds. Every data point you collect about creator performance, content decay, and audience-product fit makes your matching algorithm smarter. Starting later means starting dumber.
- Commission rates are rising. As more brands flood TikTok Shop, average affiliate commission rates are increasing. Early movers locked in top creators at 10-12%. Latecomers are paying 18-25% for equivalent talent.
The window isn't closing tomorrow. But it is narrowing. Every month you operate without a proper TikTok Shop creator analytics dashboard is a month your competitors use to build the infrastructure advantage you'll eventually need to overcome.
How to Implement This Dashboard System (Two Paths)
Path 1: Build It Yourself
If you have a data analyst, a BI tool (Looker, Tableau, or even advanced Google Sheets), and 4-6 weeks to build, you can create a basic version of these nine reports. You'll need:
- Daily data exports from TikTok Seller Center
- A structured database (Airtable, PostgreSQL, or similar)
- Custom formulas for weighted scoring, decay curve calculations, and cohort grouping
- Someone to maintain it as TikTok's data formats inevitably change
Realistic timeline: 6-8 weeks to build, ongoing maintenance of 5-10 hours/week.
Best for: Brands with in-house data teams doing under $50K/month in affiliate GMV who want to learn the mechanics before investing in a managed solution.
Path 2: Let MomentIQ Build It For You
MomentIQ's creator analytics infrastructure includes all nine reports described above — plus real-time scoring, automated reactivation triggers, algorithmic creator-product matching through Reacher, and a strategic layer where our team interprets the data and executes on it.
This isn't a dashboard you log into and figure out. It's a managed intelligence system where the data drives action — new creator recruitment, commission restructuring, product seeding optimization, and dormant creator reactivation — all handled by a team that has managed creator programs generating $50M+ in cumulative TikTok Shop GMV.
Best for: Brands doing $50K+/month in affiliate GMV (or targeting that level) who want to compress 6 months of learning into 30 days of execution.

The Bottom Line: Measure What Makes Money
TikTok Shop creator analytics isn't about tracking more metrics. It's about tracking the right metrics in the right structure to make faster, more profitable decisions.
The nine reports in this guide — Revenue Attribution Cohorts, Content Decay Curves, Profitability Matrices, Reactivation Triggers, Content-to-Conversion Gap Analysis, Creator Velocity Indexes, Commission Efficiency Reports, Cross-Product Performance Maps, and Portfolio Risk Assessments — aren't nice-to-haves.
They're the infrastructure that separates brands plateauing at $30K/month from brands scaling past $300K/month.
The data is already there. It's sitting in your Seller Center, in your creator communications, in your seeding logs. The question is whether you're going to leave it scattered across 14 tabs and 6 spreadsheets — or build the system that turns it into revenue.
Ready to replace spreadsheet chaos with a real-time TikTok Shop creator analytics dashboard? Book your free growth audit with MomentIQ at bemomentiq.com and get a custom creator performance scorecard for your top 50 affiliates. As TikTok Shop Partner of the Year, we've built the analytics infrastructure behind some of the fastest-scaling brands on the platform. Your competitors are already measuring what matters. It's time you did too.