TikTok Shop Live Commerce Analytics Decoded
Discover the 14 TikTok Shop live commerce metrics that separate 6-figure streams from flops. Learn exactly what top sellers track to maximize GMV every session.
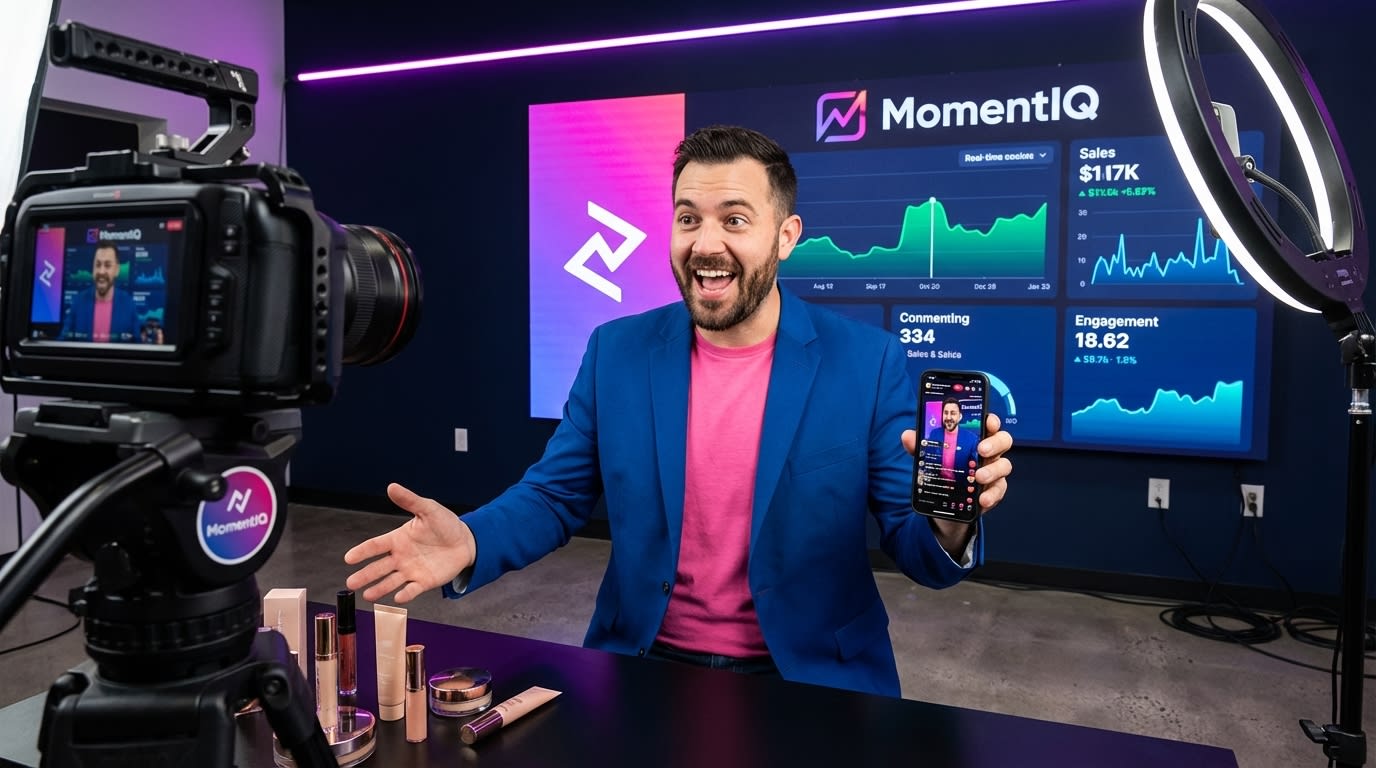
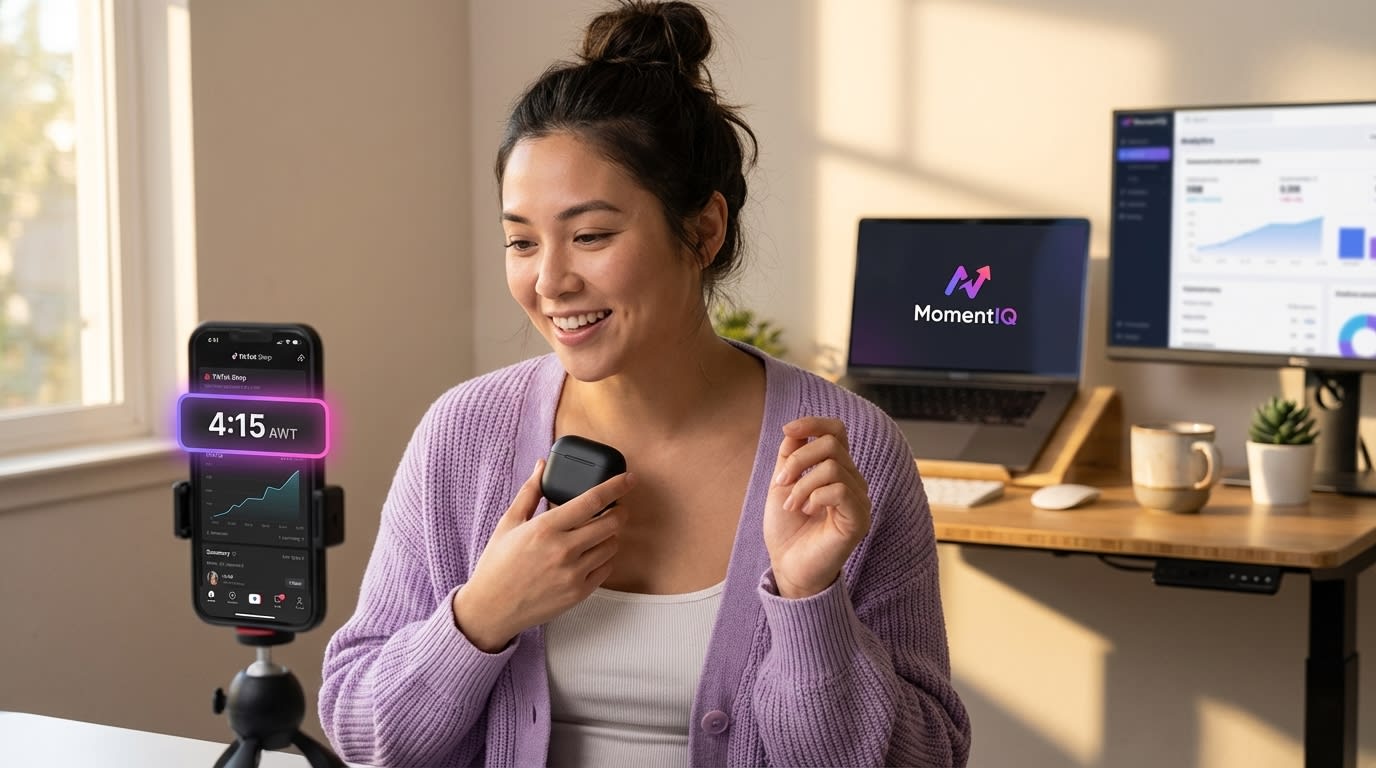
You just wrapped a two-hour live stream. You're exhausted. Your voice is shot. You showed twelve products, ran three flash deals, and kept the energy high the entire time.
- Analyze your data between streams, not during them — the top 5% of TikTok Shop live sellers capture over 60% of total live GMV.
- Cross-reference your Peak Concurrent Viewer timing with your product showcase schedule to identify which moments TikTok's algorithm rewarded with distribution.
- If your PCV spikes early then drops, strengthen mid-stream retention — your opening hook works but your content loses viewers.
- Replicate engagement velocity spikes by identifying exactly what you were doing when TikTok pushed your stream to the For You Page.
- Target platform benchmarks: aim for 50-200 PCV as a new seller, scaling toward 1,000-10,000+ as you optimize using live analytics.
Then you check the numbers: $387 in total GMV.
Meanwhile, a competitor in your exact category — selling similar products at similar price points — just pulled $14,000 from a stream half the length.
The difference isn't charisma. It's not luck. It's what they see in their TikTok Shop live analytics that you're completely ignoring.
Most sellers treat post-stream data like a report card: glance at total revenue, feel good or bad, then do the exact same thing next time.The brands consistently generating five- and six-figure live sessions treat that data like a flight plan — every metric informs a specific adjustment for the next stream.
This guide breaks down the 14 TikTok live selling metrics that actually matter, shows you exactly how to read them, and — more importantly — tells you what to do with each one. If you've been streaming into the void wondering why your numbers won't budge, this is your diagnostic manual.
Already running live streams but frustrated with inconsistent results? MomentIQ helps brands decode their live commerce data and build repeatable, scalable streaming systems.Talk to a Strategist and let our strategists show you exactly where your streams are leaking revenue.
Why TikTok Shop Live Analytics Matter More Than You Think

Here's what most sellers get wrong about TikTok live commerce: they think the magic happens during the stream. In reality, the magic happens between streams — in the 24-48 hours when you're dissecting data and making surgical adjustments.
TikTok's own commerce reports reveal that live shopping sessions on TikTok generate 10x higher engagement rates than static product listings. According to a 2024 Statista forecast, live commerce in the U.S.$55 billion by 2026, up from roughly $20 billion in 2023. The channel isn't just growing — it's accelerating.
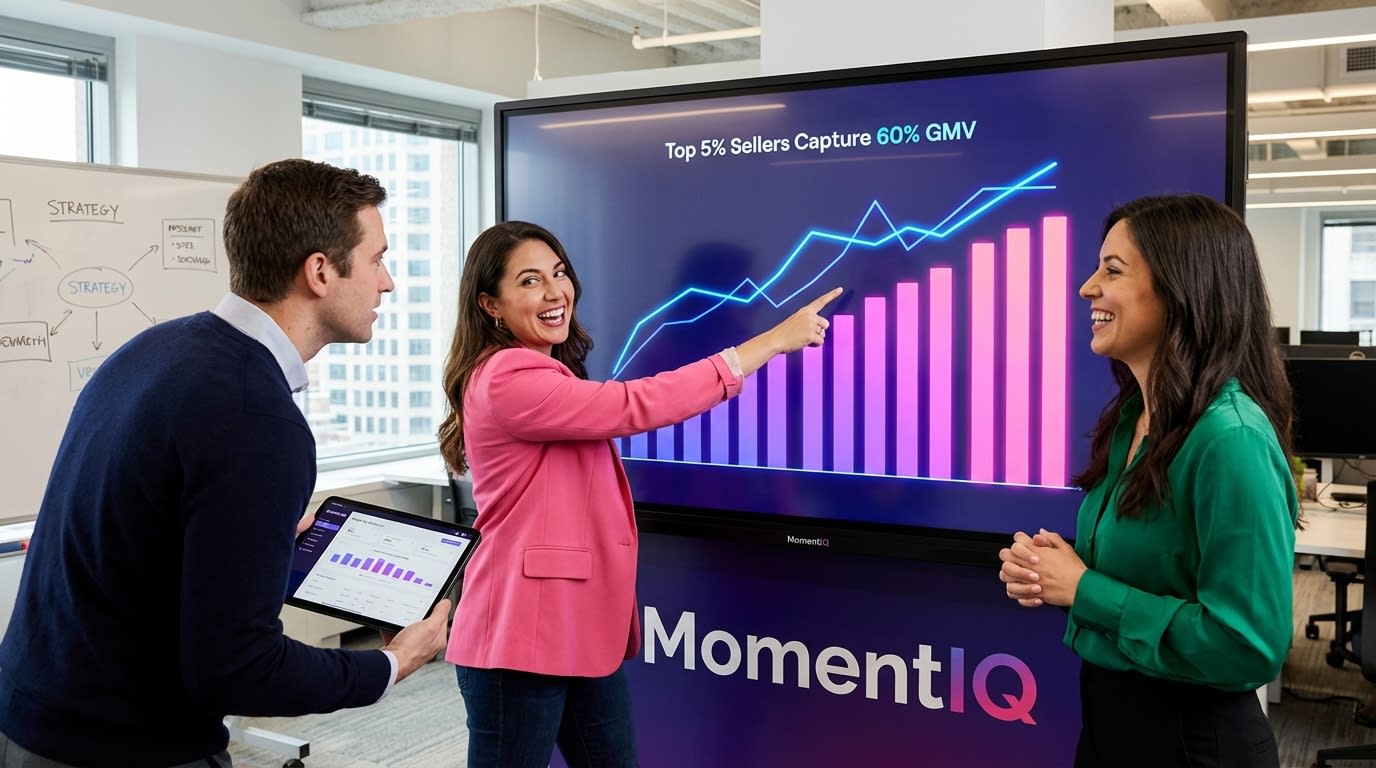
But here's the uncomfortable truth: the top 5% of TikTok Shop live sellers capture over 60% of total live GMV in most categories. The gap between winners and everyone else isn't narrowing. It's widening.And the primary differentiator is how sellers use their TikTok Shop live stream KPIs to compound performance session over session.
Let's break down every metric that matters.
The 14 TikTok Live Selling Metrics That Drive Revenue
Metric 1: Peak Concurrent Viewers (PCV)
What it is: The highest number of simultaneous viewers at any single moment during your stream.
Why it matters: PCV is your ceiling metric. It tells you the maximum audience your stream attracted — and more importantly, when that peak happened. Cross-reference PCV timing with your product showcase schedule and you'll discover which moments the algorithm rewarded with distribution.
What good looks like:
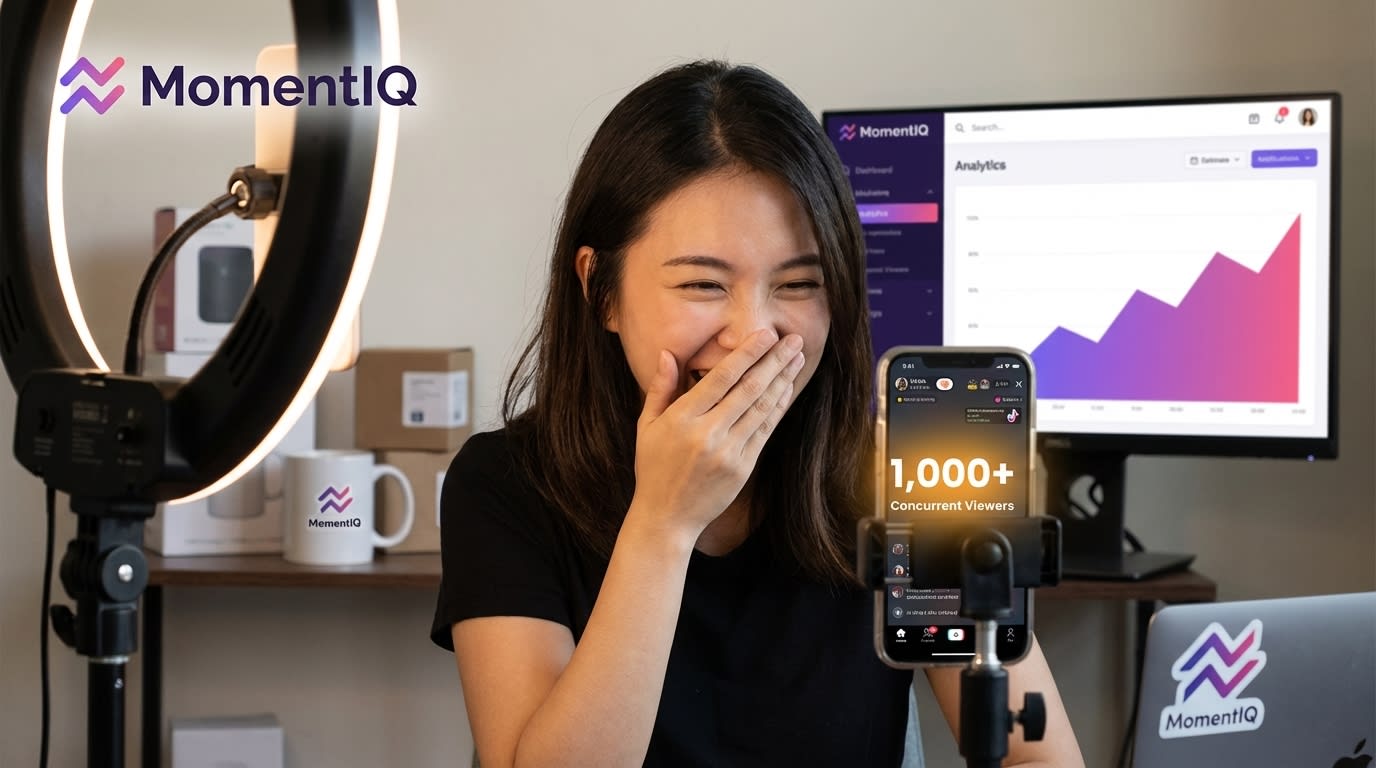
- New sellers: 50-200 PCV
- Growing sellers: 200-1,000 PCV
- Scaled sellers: 1,000-10,000+ PCV
How to act on it: If your PCV spike happens in the first 15 minutes and then declines, your opening hook is strong but your mid-stream retention is weak.If PCV spikes randomly mid-stream, identify what you were doing at that exact moment — TikTok's algorithm pushes streams to the For You Page when engagement velocity spikes, so that moment is your template for future streams.
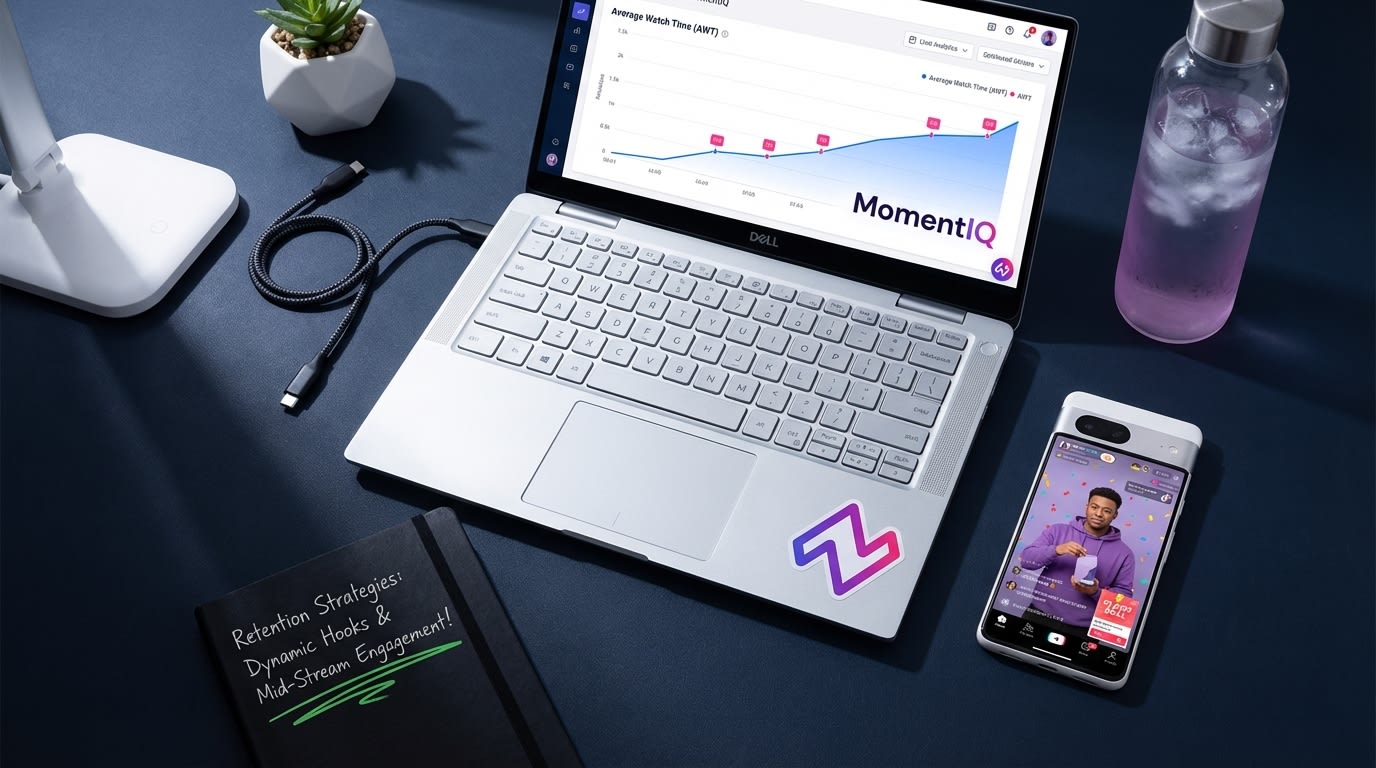
Metric 2: Average Watch Time (AWT)
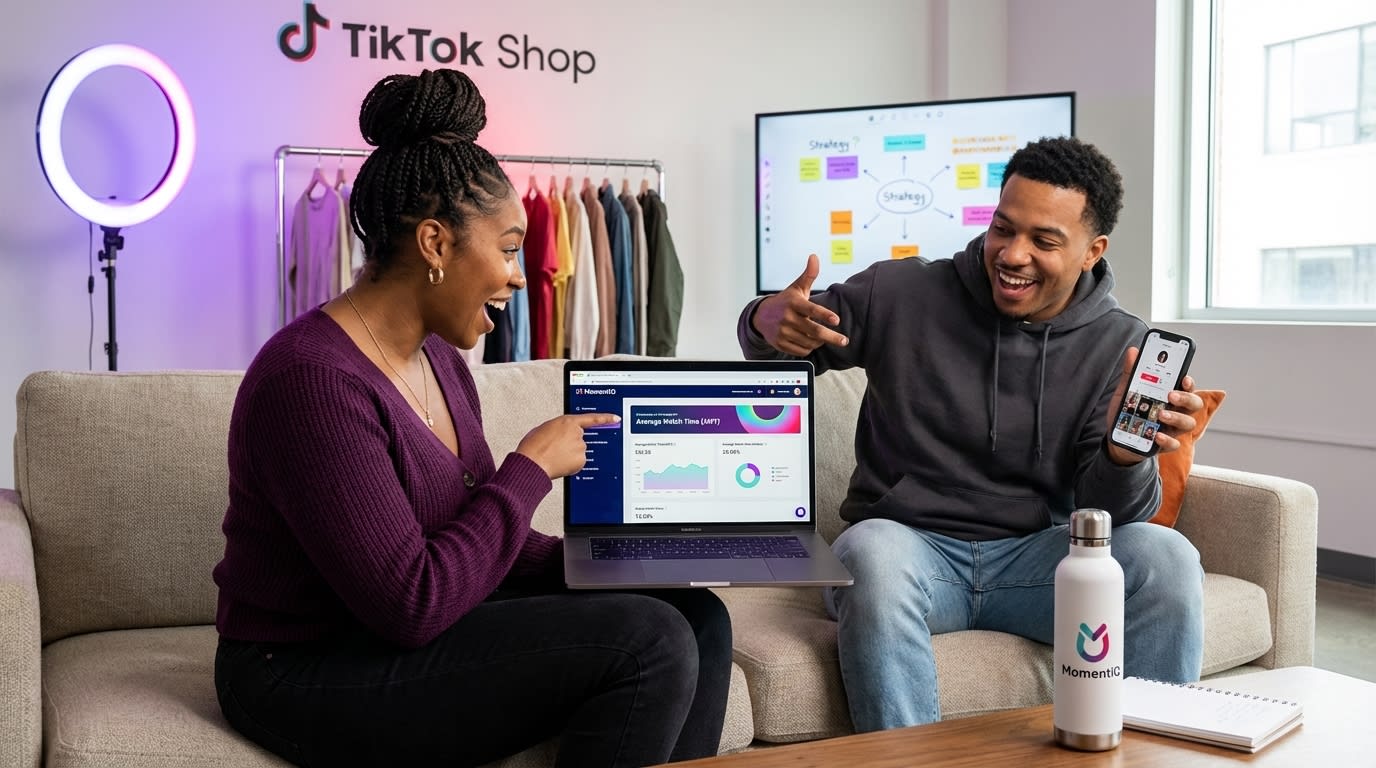
What it is: The mean duration viewers spend watching your stream before leaving.
Why it matters: This is arguably the single most important signal for TikTok's live distribution algorithm. Streams with average watch times above 3 minutes receive significantly more algorithmic push than those hovering at 30-60 seconds. AWT directly controls how many new viewers TikTok sends your way.
The benchmark most sellers miss: If your AWT is under 90 seconds, your stream has a structural problem — likely pacing, energy, or product presentation.Be
tween 90 seconds and 3 minutes, you're in the optimization zone. Above 3 minutes, you're in the algorithmic sweet spot.
How to act on it: Map your AWT against your stream segments. Did AWT spike during product demos? During Q&A? During flash sales?Build your next stream's run sheet around whatever kept people watching longest.
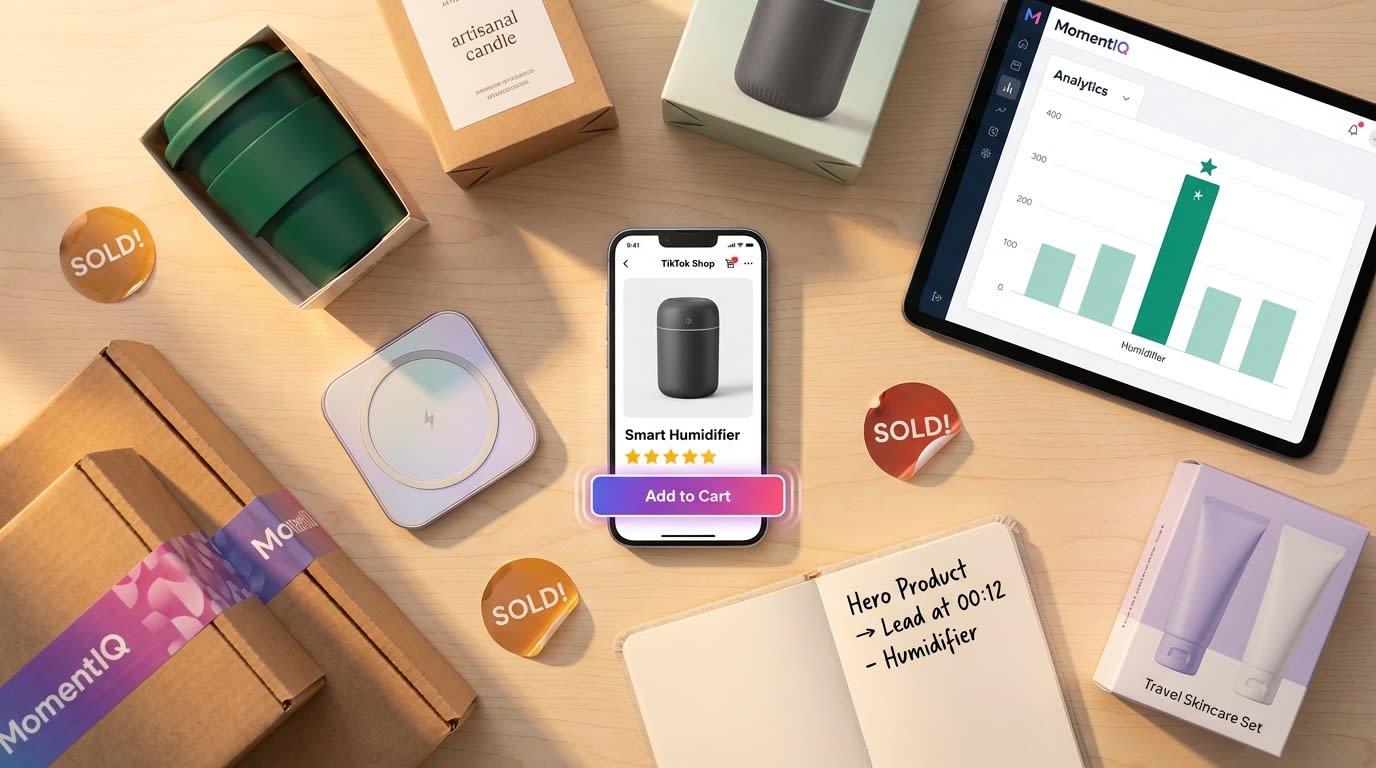
Metric 3: Add-to-Cart Rate Per Product Shown
What it is: The percentage of viewers who added a specific product to their cart while it was being actively showcased.
Why it matters: This metric isolates product-level performance from overall stream performance. A stream might generate decent total revenue, but if 80% of it comes from one SKU while five others flatlined, you need to know that.
How to calculate it: (Number of add-to-carts for Product X ÷ Number of viewers during Product X showcase) × 100
What to do with it:
- Above 8% ATC rate: This product is a live stream hero.Give it more airtime, use it as your anchor, and consider building entire streams around it.- 3-8% ATC rate: Solid performer. Test different presentation angles, pricing hooks, or demo approaches to push it higher.
- Below 3% ATC rate: Either the product isn't right for live, the pre
sentation needs a complete overhaul, or the price point creates too much friction for impulse buying.
Pro insight: The brands crushing it on TikTok Shop live don't showcase every SKU equally. They lead with their highest-ATC products to build buying momentum, then introduce secondary products once the audience is in a purchasing mindset.
Metric 4: Comment-to-Sale Ratio
What it is: The relationship between total comments and total orders during a stream.
Why it matters: Comments are TikTok's primary engagement signal for live distribution. But comments alone don't pay the bills. The ratio between comments and actual purchases reveals whether your engagement is commercially productive or just noise.
A stream with 5,000 comments and 20 sales has a very different problem than a stream with 200 comments and 20 sales. The first has an audience that's entertained but not buying. The second has a buying audience that isn't engaging enough to trigger algorithmic distribution.
Target ratio: Top-performing streams typically see 1 order per 15-30 comments. If you're above 50 comments per order, your engagement is hollow. If you're below 10 comments per order, you're leaving distribution on the table.
How to act on it: Use comment-triggered selling techniques. Ask viewers to comment specific keywords ("DROP 🔥 if you want the bundle deal") that simultaneously boost engagement velocity and create buying intent. This dual-purpose tactic is what separates strategic live sellers from entertainers who happen to have a product link up.
Metric 5: Viewer Source Breakdown
What it is: Where your live viewers came from — For You Page, Following feed, Live tab, share links, or paid traffic.
Why it matters: This metric tells you whether you're building organic distribution or buying your audience. Both can work, but the economics are radically different.
What to watch for:
- For You Page > 40%: Your stream is earning algorithmic distribution. This is the scalable path.
- Following > 50%: You're preaching to the converted. Good for retention, but you need fresh audience acquisition.
- Paid traffic > 60%: Your organic signals are weak. The stream isn't compelling enough for TikTok to distribute it for free.
The strategic insight: If your FYP percentage is declining stream over stream, your content quality or engagement metrics are slipping. TikTok is showing your stream to fewer new people because the signals from previous streams told the algorithm your content doesn't retain cold audiences.
Struggling to decode your viewer source data and build organic distribution? The live commerce strategists at MomentIQ have helped brands shift from 70% paid traffic to 60%+ organic FYP distribution in under 60 days. Talk to a Strategist to see your custom live commerce scaling roadmap.
Metric 6: Cart-to-Checkout Conversion Rate
What it is: The percentage of add-to-carts that convert to completed purchases.
Why it matters: A high add-to-cart rate with a low checkout completion rate means you're creating desire but not closing. This is one of the most expensive leaks in live commerce — you've already done the hard work of getting someone interested, and you're losing them at the finish line.
Benchmarks:
- Below 30%: Significant checkout friction — pricing, shipping costs, or trust issues
- 30-50%: Average performance, room for optimization
- Above 50%: Strong closing mechanics
Common fixes: Announce free shipping thresholds during the stream, use countdown timers for bundle deals, and verbally walk viewers through the checkout process. Many viewers, especially those new to TikTok Shop, don't realize how seamless the in-app checkout is. Literally saying "tap the cart, hit checkout, it takes 10 seconds" can lift conversion rates by 15-20%.
Metric 7: Revenue Per Viewer (RPV)
What it is: Total stream GMV divided by total unique viewers.
Why it matters: RPV normalizes your performance regardless of audience size. A stream that generates $5,000 from 500 viewers (RPV = $10) is dramatically outperforming a stream that generates $5,000 from 10,000 viewers (RPV = $0.50).
Why this matters for scaling: When you eventually layer paid traffic onto your live streams (via TopView ads or Live Shopping Ads), your RPV determines whether paid acquisition is profitable. If your RPV is $2.00 and your cost per live viewer is $0.30, you have a 6.6x return. If your RPV is $0.20, paid traffic will bleed you dry.
Metric 8: Follower Conversion Rate

What it is: The percentage of non-following viewers who hit "Follow" during the stream.
Why it matters: Every new follower from a live stream is a future viewer you don't have to pay for. According to TikTok's commerce data, followers are 2-3x more likely to return to future live sessions and have significantly higher purchase intent than cold viewers.
Target: Aim for a 3-5% follower conversion rate from live streams. Below 2% means your stream isn't giving viewers a compelling reason to come back.
Metric 9: Product Click-Through Rate (Product CTR)
What it is: The percentage of viewers who tapped on a product card during the stream.
Why it matters: Before someone can add to cart, they have to click the product. A low product CTR with high viewership means your product pin timing is off — you're either not calling attention to the product card, or you're showcasing products that don't match your audience's interest.
Optimization tactic: Pin new products at the exact moment you begin demonstrating them, not before. Verbally direct viewers to "tap the product link that just appeared" at least 3 times during each product segment. Data from top-performing streams shows that verbal CTAs to tap the product link increase product CTR by 40-65%.
Metric 10: Stream Duration vs. Revenue Curve
What it is: A time-series view of when revenue actually occurs during your stream.
Why it matters: Most sellers assume longer streams = more revenue. The data tells a different story. Many streams hit 80% of their total revenue within a specific 20-30 minute window. Everything outside that window is dead air disguised as effort.
How to find your revenue window: Export your stream data and plot orders against timestamps. You'll typically see one of three patterns:
- Front-loaded: Most sales happen in the first 30 minutes (your audience buys early and leaves)
- Mid-peak: Sales cluster around a specific product or deal segment
- Steady-state: Revenue distributes evenly (rare, and usually indicates a well-optimized stream)
The actionable insight: If your revenue is front-loaded, consider running shorter, more frequent streams rather than marathon sessions. Two 45-minute streams will almost always outperform one 3-hour stream if your data shows front-loaded buying behavior.
Metric 11: Return Viewer Percentage

What it is: The percentage of your live audience that has watched a previous stream.
Why it matters: Return viewers buy at 3-5x the rate of first-time viewers. This metric tells you whether you're building a loyal live shopping audience or starting from zero every session.
The compounding effect: Brands that maintain a 25%+ return viewer rate see their per-stream GMV grow 15-20% month-over-month even without audience growth — because their existing audience buys more frequently and at higher AOVs.
Metric 12: Share Rate
What it is: The percentage of viewers who share your live stream to friends, groups, or their own feed.
Why it matters: Shares are the highest-intent engagement signal on TikTok. Each share acts as a personal recommendation and brings in viewers with pre-built trust. Shared viewers convert at 2-4x the rate of FYP-sourced viewers.
How to boost it: Create shareable moments — shocking reveals, unbelievable deals, entertaining demonstrations. The best live sellers engineer 2-3 "share moments" per stream where they explicitly say, "Share this with someone who needs to see this deal."
Metric 13: Engagement Velocity
What it is: The rate of likes, comments, and shares per minute during specific stream segments.
Why it matters: TikTok's algorithm doesn't just measure total engagement — it measures engagement acceleration. A sudden spike in engagement velocity is the primary trigger for TikTok to push your stream to more FYP viewers.
How to engineer velocity spikes: Schedule "engagement bombs" every 8-12 minutes: giveaway announcements, flash deals, controversial opinions about products, or interactive polls. The goal is to create concentrated bursts of activity that signal to the algorithm that something exciting is happening.
Metric 14: Post-Stream Residual Sales
What it is: Sales that occur from your stream's replay or product links in the 24-48 hours after the stream ends.
Why it matters: This is the metric almost nobody tracks — and it can represent 15-30% of total stream revenue for well-optimized sellers. TikTok allows stream replays, and viewers who were on the fence during the live session often return to purchase.
How to maximize it: Ensure your product cards remain active after the stream. Pin a comment with your top 3 products before ending. And structure your stream so the best product demonstrations are in standalone segments that make sense even without live context — because replay viewers are watching on their own timeline.
How to Build a Post-Stream Analysis System That Compounds Results
Knowing these 14 metrics is step one. Building a system that turns post-stream data into pre-stream strategy is where the real money lives.
Here's the framework top sellers use:
Step 1: The 30-Minute Post-Stream Debrief

Within 30 minutes of ending your stream, capture these while they're fresh:
- Top 3 moments that felt high-energy (you'll cross-reference these with engagement velocity data)
- Products that got the strongest verbal reactions from viewers
- Technical issues — audio drops, lighting problems, product demo failures
- Questions you couldn't answer (these become content for the next stream)
Step 2: The Data Pull (24 Hours Later)
Wait 24 hours to pull your full analytics — this ensures post-stream residual sales are captured. Build a simple spreadsheet tracking all 14 metrics across every stream. The power isn't in any single data point. It's in the trend lines across 10, 20, 50 streams.
Step 3: The Optimization Loop
For each stream, identify:
- One metric that improved from the previous stream (double down on what caused it)
- One metric that declined (diagnose and fix before the next stream)
- One new test to run next time (different product order, new engagement tactic, adjusted stream length)
This single-variable testing approach is how one supplement brand working with MomentIQ scaled their live stream GMV from $4,200 per session to $38,000 per session over 12 weeks. They didn't overhaul everything at once. They made one data-informed adjustment per stream and let the improvements compound.
Why Most Sellers Can't Do This Alone (And Why That's Okay)
Let's address the elephant in the room.
You might be reading this thinking, "Great, I'll just track all 14 metrics myself." And you can — for a while. But here's what happens in practice:
You're already wearing too many hats. You're sourcing products, managing inventory, handling customer service, creating short-form content, negotiating with creators, and trying to run live streams 3-5 times per week. Adding rigorous post-stream analytics to that workload isn't just difficult — it's the thing that consistently falls off the plate first.
This is exactly where brands stall. They know the data matters. They intend to analyze it. But the operational demands of running a TikTok Shop mean the analytics work gets perpetually deprioritized. And without the analytics, every stream is a guess.
Some sellers try hiring a general social media agency. But here's the problem: generic influencer agencies don't understand TikTok Shop's live commerce mechanics. They know Instagram Reels. They know YouTube sponsorships. They don't know how TikTok's live distribution algorithm weights engagement velocity differently than total engagement. They don't know that product pin timing affects CTR by 40-65%. They don't know how to read viewer source breakdowns to diagnose organic distribution decay.
TikTok Shop live commerce is a specialized discipline. It requires TikTok-native expertise.
"But we've tried agencies before and got burned." Fair. Most agencies sell strategy decks and monthly reports. They don't operate inside TikTok Shop's actual infrastructure. MomentIQ is different because we're a TikTok Shop Partner of the Year and official TikTok Marketing Partner — meaning we have platform-level access, direct TikTok support channels, and proprietary data that independent sellers and generic agencies simply cannot access.
Our algorithmic creator matching system (powered by our Reacher platform) doesn't just find creators — it identifies which creators' audiences have the highest live commerce purchase propensity for your specific category. That's not something you can replicate with manual outreach and spreadsheets.
"We don't have the budget for an agency." Let's do the math. If your current live streams average $2,000 per session and you stream 12 times per month, that's $24,000/month. If data-driven optimization lifts your per-stream GMV by just 3x (conservative, based on the compounding framework above), you're at $72,000/month. The delta — $48,000/month — dwarfs any agency investment. One home décor brand saw exactly this trajectory after partnering with MomentIQ, scaling from $22K to $195K in monthly live GMV within the first 90 days.
The Window Is Closing: Why Live Commerce Analytics Mastery Matters Now
According to eMarketer, TikTok's U.S. commerce GMV is projected to surpass $17.5 billion in 2025, with live commerce representing a rapidly growing share. But here's the dynamic most sellers miss:
Early movers in live commerce build algorithmic advantages that compound over time. TikTok's live distribution algorithm favors accounts with strong historical performance metrics. Every optimized stream improves your account's "live commerce score," which determines how aggressively TikTok distributes your future streams.
Brands building this track record now will have an entrenched advantage that latecomers literally cannot replicate without months of catch-up. Your competitors aren't waiting. According to TikTok's 2024 commerce report, the number of brands running regular live shopping sessions increased 280% year-over-year. The playing field is getting crowded, and the brands with data-driven live strategies are pulling away.
Every stream you run without proper analytics is a missed opportunity to build that compounding advantage. Every session where you "wing it" instead of optimizing based on data is a session where your competitors are getting smarter, faster, and harder to catch.
Your Live Commerce Analytics Action Plan
Here's your immediate next-step checklist:
- Pull data from your last 5 streams and calculate all 14 metrics outlined above
- Identify your biggest leak — is it AWT (retention problem), ATC rate (product-market fit problem), or cart-to-checkout (closing problem)?
- Build your tracking spreadsheet with all 14 metrics as columns and each stream as a row
- Implement one optimization per stream based on your worst-performing metric
- Review trend lines after 10 streams — you should see measurable improvement in at least 3-4 metrics
Or, if you want to skip the learning curve and start with a system that's already been proven across hundreds of brands and thousands of live sessions:
Talk to a Strategist. Our live commerce strategists will analyze your existing stream data, identify your highest-leverage optimization opportunities, and show you exactly how brands in your category are scaling to six-figure monthly live GMV. No pitch deck. No fluff. Just a data-backed roadmap built on the metrics that actually move the needle.
The brands that master TikTok Shop live analytics in 2025 will own their categories for years to come. The ones that keep guessing will keep wondering why their streams feel like dead air.
Which one are you going to be?
See your custom live commerce scaling roadmap → bemomentiq.com