TikTok Shop Ad Performance Benchmarks CPA, CTR, CVR &
Discover 2025 TikTok Shop ad benchmarks for CPA, CTR, CVR & ROAS by category. Compare your performance to industry standards and optimize your campaigns.
You're staring at your TikTok Shop ad dashboard, and you have no idea if your numbers are good.
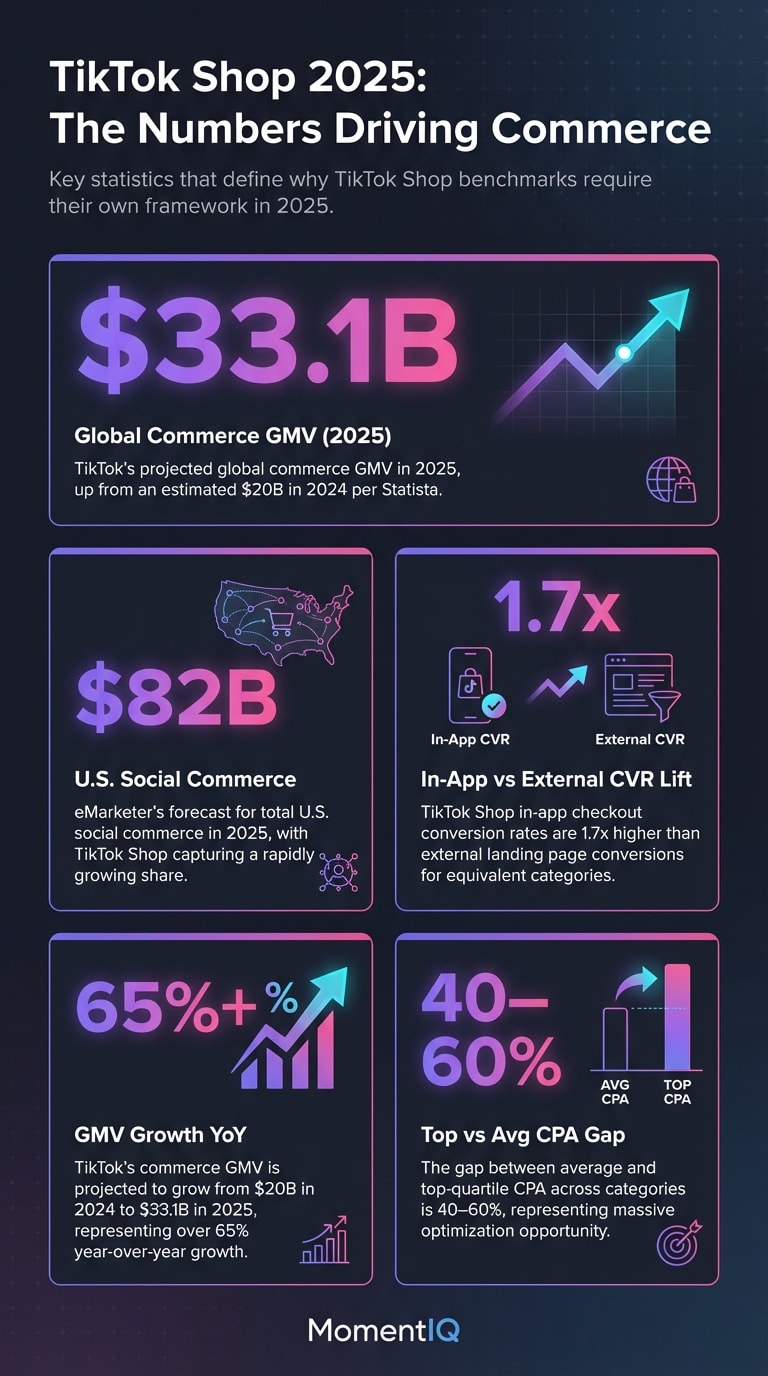
- Don't benchmark TikTok Shop ads against standard TikTok ad metrics — in-app checkout CVRs are 1.7x higher than external landing page conversions.
- Hit early conversion velocity on new campaigns to lock in algorithmic preference before CPAs inflate and competitors gain compounding advantage.
- Segment your benchmarks by product category, price point, and ad format rather than relying on generic TikTok advertising averages.
- Use TikTok Shop's $33.1B projected 2025 GMV growth as urgency to establish benchmark-beating performance now before latecomers crowd the market.
- Audit your CPA relative to product price — a $14 CPA on a $39 product demands category-specific context to determine true profitability.
Is a $14 CPA on a $39 skincare serum something to celebrate — or a sign your campaigns are hemorrhaging cash? Is a 1.8% CTR on Video Shopping Ads competitive, or are your competitors quietly doubling that while you burn through budget?
The biggest problem TikTok Shop sellers face in 2025 isn't bad performance. It's not knowing what "good" looks like.
Unlike Meta or Google, where benchmark data is abundant and mature, TikTok Shop ad benchmarks in 2025 remain frustratingly opaque. The platform is evolving so fast that last quarter's numbers are already outdated, and most "benchmark" articles online are recycling generic TikTok Ads data that has nothing to do with the unique mechanics of TikTok Shop commerce.
This post changes that.
We've compiled the most comprehensive set of TikTok Shop advertising performance data available — segmented by product category, price point, and ad format — so you can finally measure your campaigns against concrete targets instead of guessing.
Whether you're spending $5K or $100K per month, these benchmarks will tell you exactly where you stand and, more importantly, where the gaps are.
And if the gaps are bigger than you expected, MomentIQ's strategists at bemomentiq.com can build a custom scaling roadmap to close them. Book a free TikTok Shop growth audit and see how your numbers compare to the brands we help scale daily.
Let's get into the data.
Why TikTok Shop Ad Benchmarks in 2025 Require Their Own Framework
Before we dive into category-level numbers, let's address something most sellers get wrong: you cannot benchmark TikTok Shop ads against standard TikTok advertising metrics.

Here's why.
TikTok Shop ads operate in a closed-loop commerce ecosystem. The user sees the ad, clicks, and purchases — all without leaving TikTok. This fundamentally changes the conversion dynamics compared to ads that drive traffic to external Shopify or DTC sites.
According to TikTok's 2024 Commerce Report, in-app checkout conversion rates are 1.7x higher than external landing page conversions for equivalent product categories. That means a "good" CVR on TikTok Shop is structurally different from a "good" CVR on a standard TikTok traffic campaign.
Additionally, TikTok Shop's algorithm weights purchase signals differently. The platform's recommendation engine prioritizes ads that generate completed transactions, creating a compounding advantage for sellers who hit early conversion velocity. Miss the window, and your CPAs inflate while competitors lock in algorithmic preference.
Statista projects TikTok's global commerce GMV will exceed $33.1 billion in 2025, up from an estimated $20 billion in 2024. eMarketer forecasts that U.S. social commerce will reach $82 billion this year, with TikTok Shop capturing a rapidly growing share.The sellers establishing benchmark-beating ad performance now are building moats that latecomers will struggle to breach.
This is the context your benchmarks live in. Now let's break them down.
TikTok Shop CPA Benchmarks by Product Category (2025)
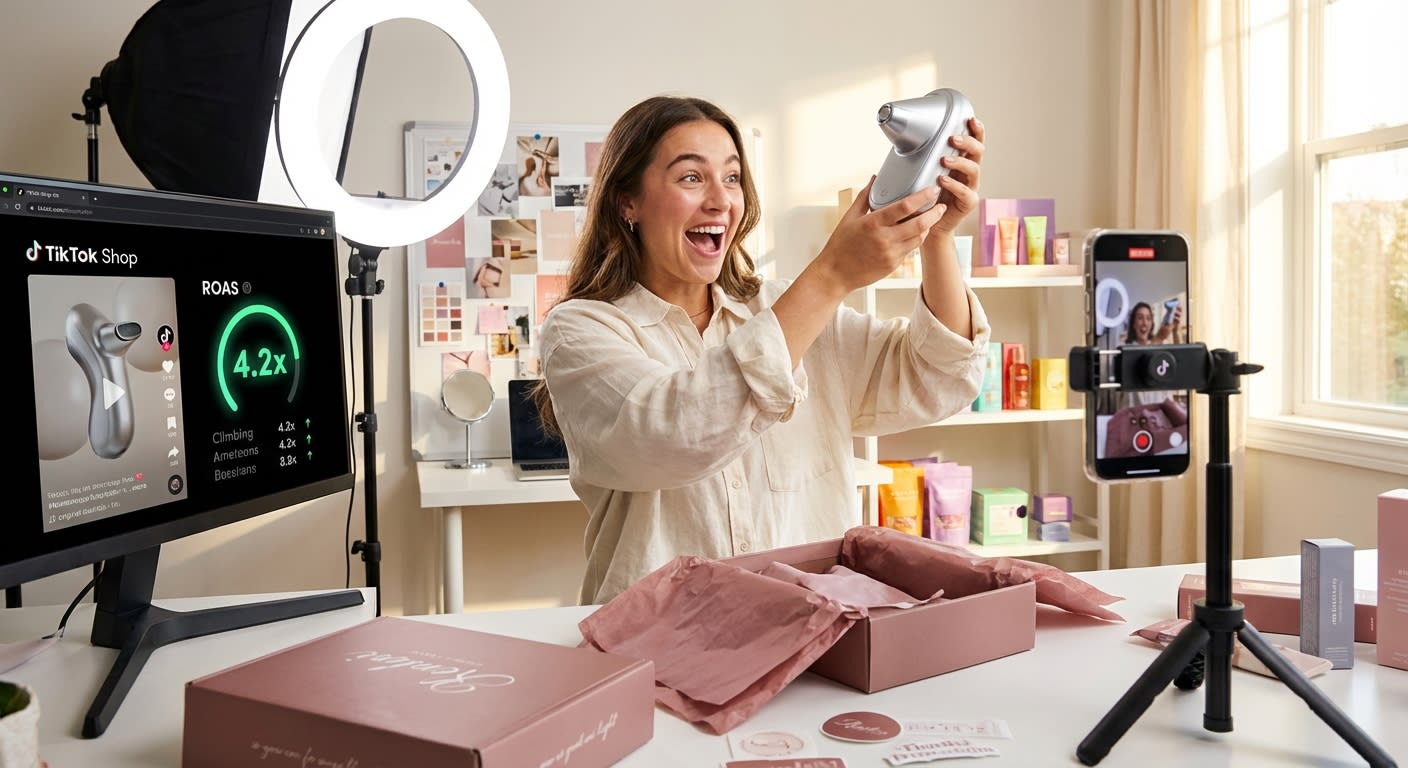
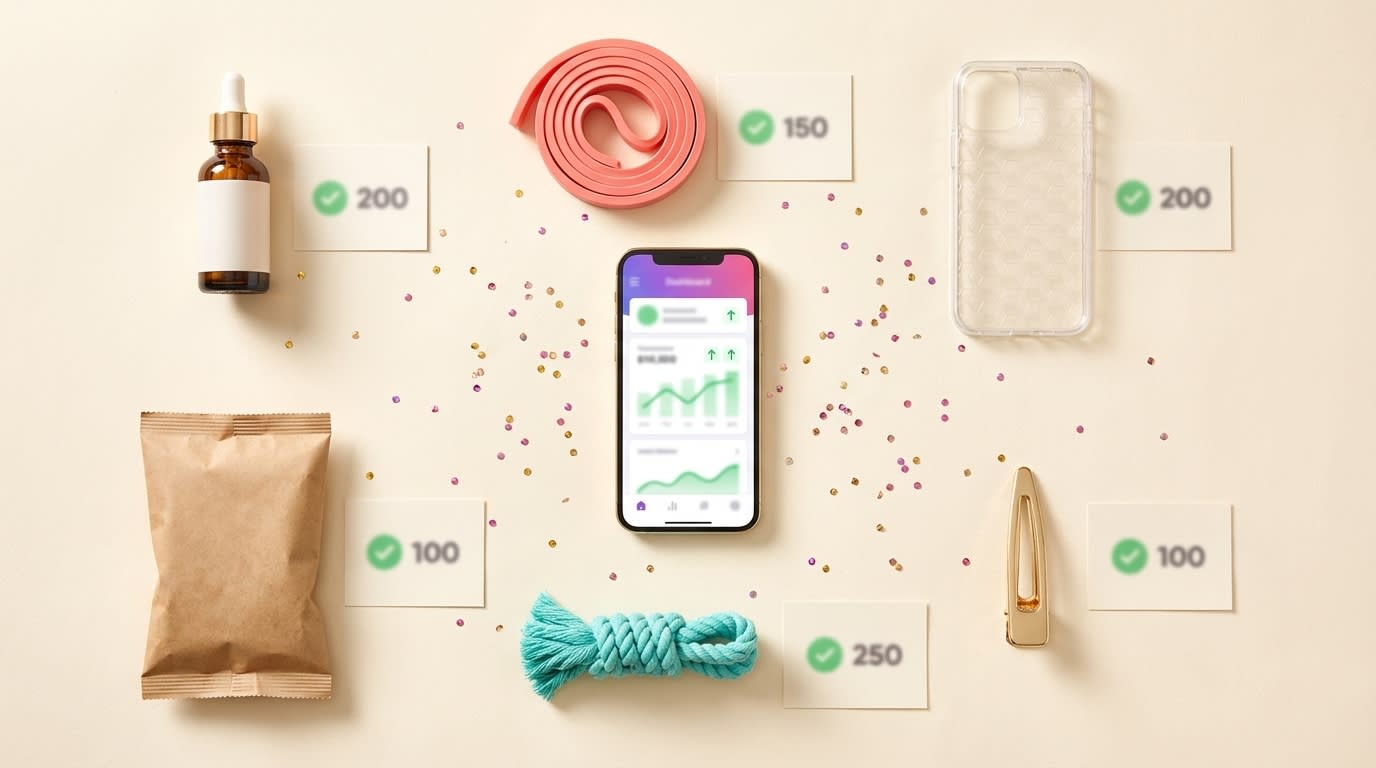
ktok-shop-ad-performance-benchmarks-2025-cpa-ctr-cvr-roas-by-category-so-you-k-tiktok-creator-joyfully-opening-multiple-a.jpg)

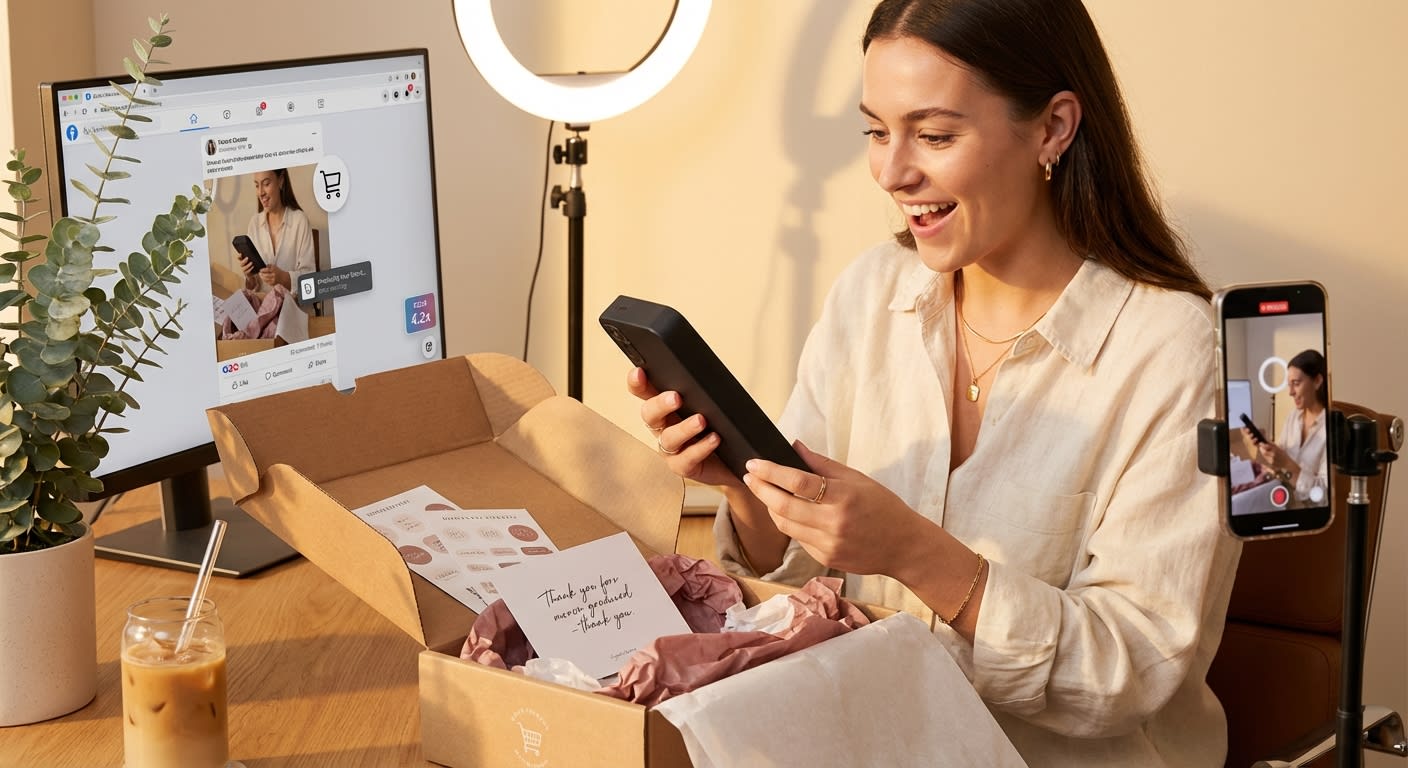
ing category-segmented campaigns with real-time revenue notifications](https://res.cloudinary.com/dyj6g3mtf/image/upload/f_auto,q_auto/v1773187830/momentiq/blog/tiktok-shop-ad-performance-benchmarks-2025-cpa-ctr-cvr-roas-by-category-so-you-k-tiktok-shop-ad-manager-showing-category--a.jpg)
nfographic-102.png)
Cost per acquisition is the metric that keeps sellers up at night — and for good reason. Your CPA determines whether TikTok Shop is a profit engine or a money pit.
Here are the CPA ranges we're seeing across major TikTok Shop categories in 2025, based on aggregated industry
data and performance patterns from top-performing accounts:
Beauty & Skincare
- Average CPA: $11–$18

- Top-quartile CPA: $6–$10
- Key driver: UGC-style creator content consistently outperforms polished brand creative by 40–60% on CPA efficiency beauty brand ad case studies with ROAS breakdowns
Health & Supplements
- Average CPA: $16–$28
- Top-quartile CPA: $9–$15
- Key driver: Before/after transformation hooks and ingredient education content drive the lowest CPAs wellness brand TikTok Shop strategies
Fashion & Apparel
- Average CPA: $13–$22

- Top-quartile CPA: $7–$12
- Key driver: Try-on and styling content with strong hooks in the first 1.5 seconds fashion brand TikTok Shop strategies
Home & Kitchen
- Average CPA: $15–$25

- Top-quartile CPA: $8–$14
- Key driver: Problem-solution demonstrations and "oddly satisfying" product reveals home and kitchen brand niche strategies
Electronics & Gadgets
- Average CPA: $20–$40

- Top-quartile CPA: $12–$22
- Key driver: Unboxing sequences and feature comparison content; higher AOV justifies elevated CPA electronics brands dominating TikTok Shop
Food & Beverage
- Average CPA: $8–$15
- Top-quartile CPA: $4–$8
- Key driver: Taste tests, recipe integrations, and ASMR-style content formats
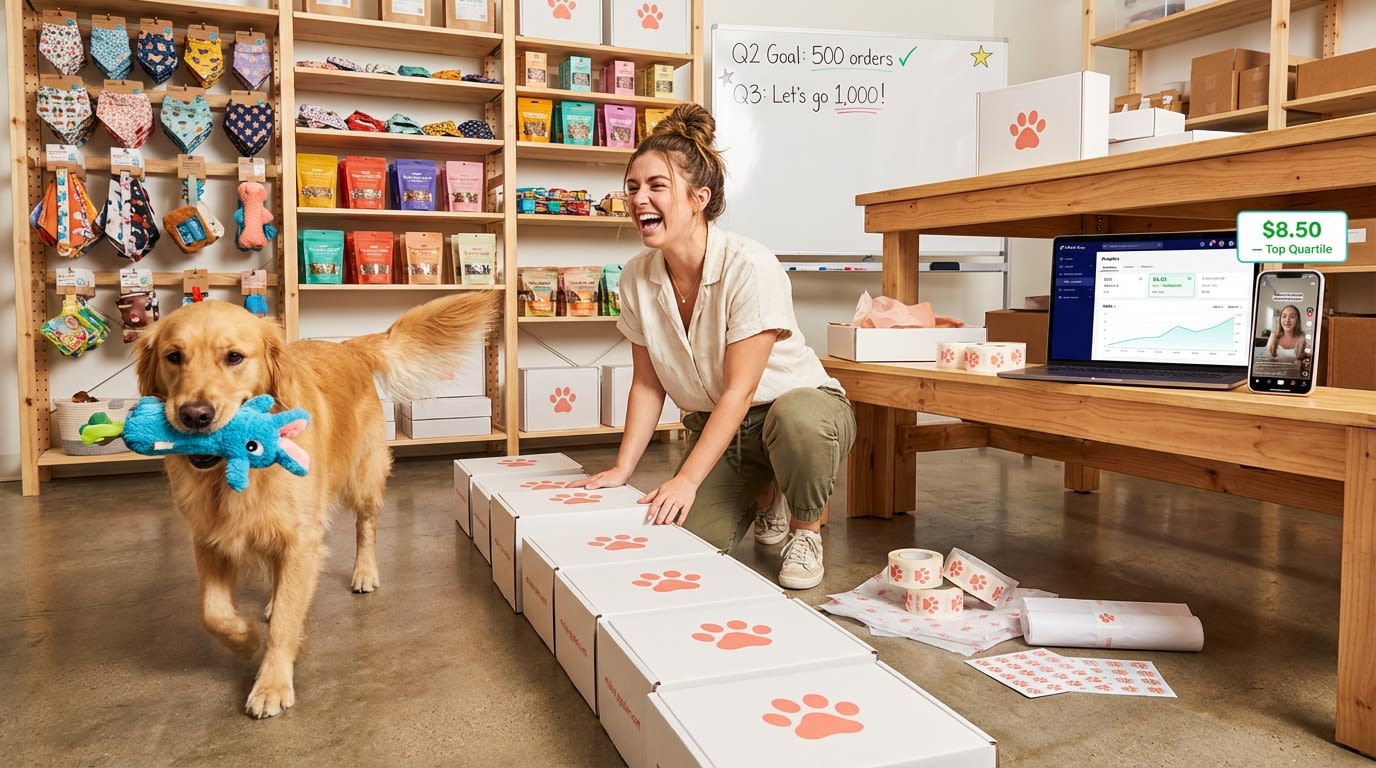
Pet Products
- Average CPA: $12–$20
- Top-quartile CPA: $6–$11
- Key driver: Pet reaction videos and owner testimonials; emotional content significantly outperforms feature-focused creative pet brand influencer campaign case studies
The gap between average and top-quartile CPA is massive — often 40–60%. That gap represents the difference between brands running generic campaigns and brands running optimized, creator-driven strategies with proper audience layering.
If your CPAs are sitting above the average ranges listed here, you're not just underperforming — you're subsidizing your competitors' growth while your own margins erode.
TikTok Shop CTR Benchmarks by Ad Format (2025)
Click-through rate on TikTok Shop isn't just a vanity metric. CTR is the leading indicator of algorithmic favor. TikTok's ad delivery system rewards high-engagement creative with lower CPMs and broader distribution, creating a virtuous cycle for top performers.

Video Shopping Ads (VSA)
- Average CTR: 1.4%–2.2%
- Top-quartile CTR: 2.8%–4.5%
- Best practice: Native-feeling creator content with product tag integration; avoid anything that "looks like an ad"
Product Shopping Ads (PSA)
- Average CTR: 0.9%–1.6%

- Top-quartile CTR: 1.8%–2.8%
- Best practice: Optimized product imagery, competitive pricing visibility, and strong catalog feed data
Spark Ads (Boosted Creator/Organic Content)
- Average CTR: 1.8%–3.0%
- Top-quartile CTR: 3.5%–6.2%
- Best practice: Boosting already-proven organic content from creators; the social proof of real engagement compounds ad performance
Live Shopping Ads
- Average CTR: 1.1%–1.9%
- Top-quartile CTR: 2.4%–3.8%
- Best practice: Teaser-style creative that builds curiosity about live-exclusive deals
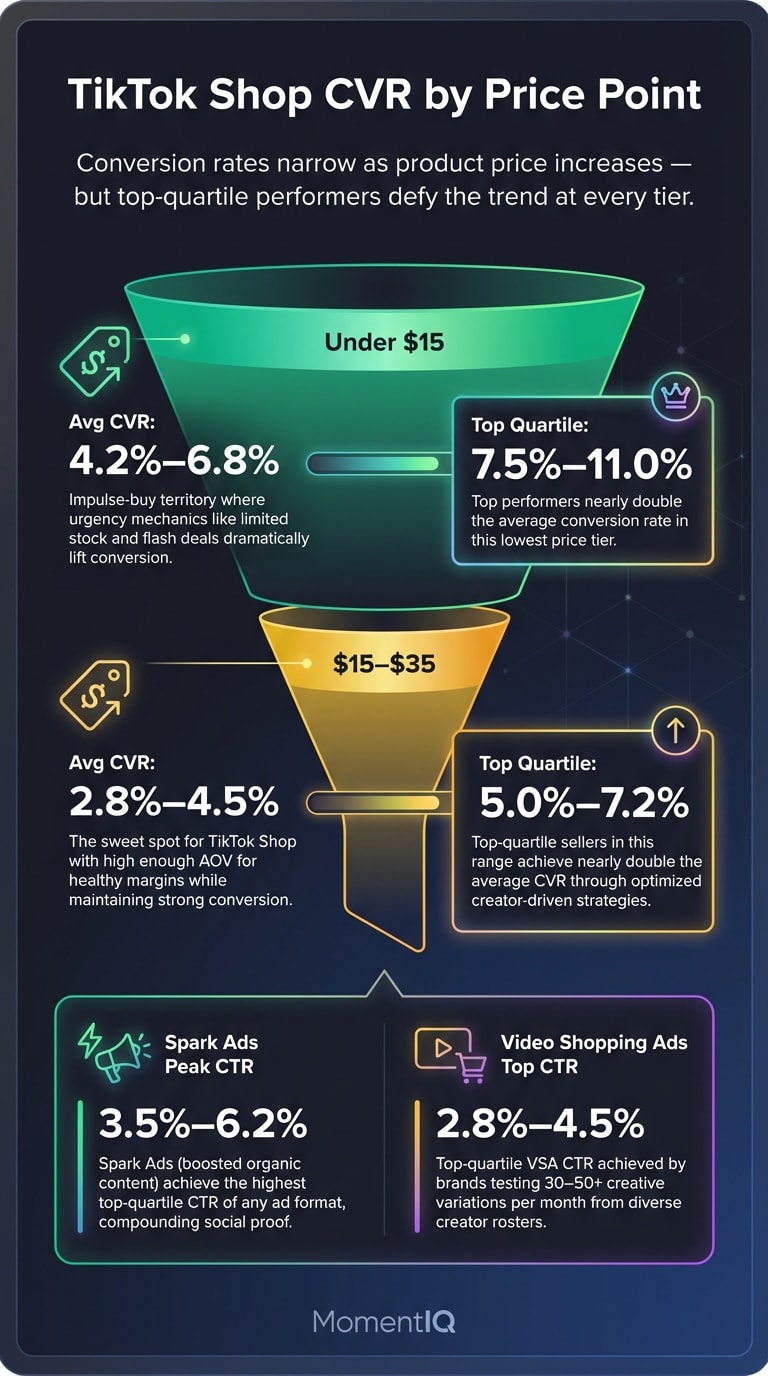
Here's what most sellers miss about CTR: the top-quartile numbers above aren't achieved through better targeting alone. They're achieved through volume of creative testing. The brands hitting 4%+ CTR on Video Shopping Ads are typically testing 30–50 creative variations per month, sourced from a diverse roster of creators.
This is exactly where most in-house teams hit a wall. You can't test 50 creative variations per month when you're manually managing 15 creators who ghost you half the time. Scale requires systems — algorithmic creator matching, automated product seeding, and performance-based optimization loops.
That's the infrastructure MomentIQ builds for brands. One supplement brand we worked with scaled from $18K to $420K/month in 90 days by deploying our creator matching system to generate a constant pipeline of high-CTR creative assets. They went from testing 5 creatives per month to 60+, and their average CTR jumped from 1.6% to 3.9%.
Want to see what that kind of creative velocity could do for your brand? Talk to a Strategist and get a custom creative scaling roadmap.
TikTok Shop CVR Benchmarks by Price Point (2025)
Conversion rate on TikTok Shop is where the money is made or lost. And price point is the single biggest variable most benchmark reports ignore.

TikTok Shop's impulse-purchase mechanics favor lower price points, but that doesn't mean higher-priced products can't convert — they just require different strategies.
Products Under $15
- Average CVR: 4.2%–6.8%
- Top-quartile CVR: 7.5%–11.0%
- Notes: Impulse-buy territory; urgency mechanics (limited stock, flash deals) dramatically lift conversion
Products $15–$35
- Average CVR: 2.8%–4.5%

- Top-quartile CVR: 5.0%–7.2%
- Notes: The sweet spot for TikTok Shop; high enough AOV for healthy margins, low enough for impulse behavior
Products $35–$75
- Average CVR: 1.5%–3.0%

- Top-quartile CVR: 3.2%–5.0%
- Notes: Requires stronger social proof and more touchpoints; retargeting becomes essential
Products $75–$150
- Average CVR: 0.8%–1.8%

- Top-quartile CVR: 2.0%–3.5%
- Notes: Multi-touch funnel architecture is non-negotiable; single-ad conversion is rare
Products Over $150
- Average CVR: 0.4%–1.2%

- Top-quartile CVR: 1.3%–2.5%
- Notes: Requires full-funnel strategy combining awareness, consideration, and retargeting with live commerce support
Critical insight: the CVR gap between average and top-quartile widens as price increases. At the sub-$15 level, the gap is roughly 1.7x. At the $75+ level, it's 2.5x or more. This means the cost of running unoptimized campaigns gets exponentially more painful as your AOV increases.
If you're selling products above $35 and your CVR is sitting in the average range, you're leaving enormous revenue on the table. The fix isn't lowering your price — it's building a proper retargeting funnel architecture and generating enough creator content to nurture purchase intent across multiple touchpoints.
TikTok Shop ROAS Benchmarks by Category and Ad Format (2025)
Return on ad spend is the ultimate scorecard. But ROAS without context is meaningless. A 3x ROAS on a 70%-margin beauty product is wildly different from a 3x ROAS on a 25%-margin electronics item.

Here's what competitive ROAS looks like across categories:
Beauty & Skincare
- Average ROAS: 2.8x–4.2x
- Top-quartile ROAS: 5.0x–8.5x
- Breakeven ROAS (typical): 1.8x–2.2x
Health & Supplements
- Average ROAS: 2.2x–3.5x

- Top-quartile ROAS: 4.5x–7.0x
- Breakeven ROAS (typical): 2.0x–2.5x
Fashion & Apparel
- Average ROAS: 2.5x–3.8x
- Top-quartile ROAS: 4.0x–6.5x
- Breakeven ROAS (typical): 1.5x–2.0x
Home & Kitchen
- Average ROAS: 2.0x–3.2x
- Top-quartile ROAS: 3.8x–6.0x
- Breakeven ROAS (typical): 1.8x–2.3x
Electronics & Gadgets
- Average ROAS: 1.8x–2.8x
- Top-quartile ROAS: 3.5x–5.5x
- Breakeven ROAS (typical): 2.2x–3.0x
Food & Beverage
- Average ROAS: 3.2x–5.0x
- Top-quartile ROAS: 6.0x–10.0x+
- Breakeven ROAS (typical): 1.5x–2.0x
By ad format, ROAS performance follows a clear hierarchy:
- Spark Ads (boosted creator content): Highest average ROAS — the combination of social proof and native feel drives superior conversion economics
- Video Shopping Ads: Strong ROAS when paired with high-volume creative testing and audience segmentation
- Live Shopping Ads: Variable ROAS depending on host quality and stream optimization, but top performers achieve the highest peak ROAS of any format
- Product Shopping Ads: Most consistent but typically lower ROAS; best used for catalog-wide coverage and retargeting
According to TikTok's own commerce data, sellers who combine at least three ad formats see 28% higher blended ROAS compared to single-format advertisers. The algorithm rewards multi-format presence because it increases the total surface area for conversion across different user behaviors.
The Hidden Benchmark: Creative Fatigue Rate by Category
Here's a benchmark most sellers don't even track — and it's silently destroying their campaigns.
Creative fatigue rate measures how quickly an ad's performance degrades after launch. On TikTok Shop, this metric is brutally fast compared to other platforms.
- Beauty & Skincare: Creative fatigue onset at 5–8 days
- Fashion & Apparel: Creative fatigue onset at 4–7 days
- Health & Supplements: Creative fatigue onset at 7–12 days
- Home & Kitchen: Creative fatigue onset at 6–10 days
- Electronics: Creative fatigue onset at 8–14 days
- Food & Beverage: Creative fatigue onset at 3–6 days
This is the metric that separates brands that scale from brands that stall. If your best-performing creative fatigues in 6 days and you can only produce 4 new creatives per month, you're mathematically guaranteed to have performance gaps. Your CPAs spike, your ROAS craters, and you start thinking "TikTok Shop doesn't work" when the real problem is creative velocity.
Top-performing TikTok Shop advertisers maintain a creative refresh rate of 8–15 new assets per week. That's not a typo. And that volume is essentially impossible to achieve with an in-house team manually recruiting and managing creators.
This is precisely why brands partner with MomentIQ. Our algorithmic creator matching system — powered by proprietary data analytics and our Reacher platform (reacherapp.com) — enables brands to maintain a constant pipeline of fresh, high-converting creator content. One beauty brand we worked with went from $12K to $340K/month in GMV within 90 days, primarily by solving the creative fatigue problem through scaled creator content production.
Why Your Benchmarks Are Probably Worse Than They Should Be (And What to Do About It)
Let's be direct. If your numbers are sitting at or below the average benchmarks listed above, there are usually four root causes:
1. Insufficient Creative Volume
You're running 5–10 creatives when you need 40–60. Every underperforming creative is dragging your blended metrics down, and you don't have enough winners in rotation to compensate for fatigue.
2. Manual Creator Management
You're spending 15+ hours per week on creator outreach, negotiation, and follow-up — and still only activating a fraction of the creators you need. Your affiliate acceptance rates are below 5%, and the creators who do accept often deliver content that doesn't convert.
3. Single-Format Strategy
You're relying on one ad format (usually Video Shopping Ads) instead of building a multi-format strategy that captures users at different intent levels. Your funnel has gaps, and potential customers are leaking out at every stage.
4. No Systematic Optimization Loop
You're making decisions based on gut feel instead of performance data. You don't have a clear framework for identifying which creative elements drive conversion, which audience segments are most profitable, or when to kill underperforming campaigns.
Here's the uncomfortable truth: most sellers know these problems exist but convince themselves they can solve them internally. "We'll hire a TikTok specialist." "We'll build a creator database." "We'll figure out the ad formats."
But the math doesn't work. A single in-house hire costs $60K–$90K annually (fully loaded), can manage maybe 20–30 creator relationships, and produces a fraction of the creative volume needed to compete. Meanwhile, the brands working with specialized TikTok Shop agencies are deploying 200–500+ creators simultaneously and testing creative at a pace that makes in-house efforts look like a science fair project.
The ROI math on agency partnership is straightforward: if an agency investment of $X per month generates 3–5x that amount in incremental profitable GMV, the agency isn't a cost — it's a profit center. The brands we work with at MomentIQ typically see positive ROI within the first 30–45 days.
How to Use These Benchmarks: A Practical Framework
Data without action is just trivia. Here's how to actually use these TikTok Shop ad benchmarks to improve your performance:
Step 1: Identify Your Category and Price Point Benchmarks
Find your category and price tier in the tables above. Note both the average and top-quartile numbers for CPA, CTR, CVR, and ROAS.
Step 2: Calculate Your Gap Score
For each metric, calculate the percentage difference between your current performance and the top-quartile benchmark. This is your "gap score." Prioritize closing the largest gaps first.
Step 3: Diagnose the Root Cause
- High CPA + Low CTR = Creative problem. Your content isn't stopping thumbs. You need more creative testing volume and better hooks.
- High CTR + Low CVR = Offer or landing problem. People are clicking but not buying. Check your pricing, product page, reviews, and checkout friction.
- Decent CVR + Low ROAS = Targeting or bid problem. You're converting the wrong people or paying too much for impressions. Refine your audience layers.
- All metrics below average = Structural problem. You likely need a complete strategy overhaul, not incremental tweaks.
Step 4: Set 30-Day Sprint Targets
Don't try to jump from average to top-quartile overnight. Set realistic 30-day targets that move each metric 15–25% toward the top-quartile benchmark.
Step 5: Build the Infrastructure to Sustain Improvement
This is where most sellers fail. They'll optimize for a week, see improvement, get distracted by other priorities, and watch their numbers regress. Sustained benchmark-beating performance requires sustained systems — creative pipelines, creator networks, optimization frameworks, and data analytics that run continuously.
The "We've Tried Agencies Before" Conversation
We hear this constantly. And honestly? Most of the time, the skepticism is justified.
Most agencies that claim to "do TikTok" are really Meta or Google agencies who bolted on TikTok as an afterthought. They don't understand TikTok Shop's closed-loop commerce model. They don't have relationships with TikTok-native creators. They run the same playbooks they use on Instagram and wonder why the results are mediocre.
MomentIQ is different because TikTok Shop is all we do. We're not a generalist agency that added a TikTok offering. We're a TikTok Shop Partner of the Year and TikTok Marketing Partner — credentials that require demonstrated performance at scale, not just a sales pitch.
Specifically, here's what separates MomentIQ from the agency you tried before:
- Algorithmic creator matching vs. manual outreach spreadsheets. Our proprietary system matches your products with creators based on audience demographics, content style, engagement patterns, and historical conversion data — not just follower count.
- Product seeding at scale vs. sending 20 packages and hoping for the best. We manage the entire seeding logistics pipeline, from fulfillment to follow-up to content quality assurance.
- Full-stack commerce support vs. "we'll run your ads." We optimize across organic content, paid amplification, creator affiliate programs, live commerce, and catalog management — because TikTok Shop performance is a system, not a single channel.
- Proprietary performance data vs. guessing. We have benchmark data across hundreds of campaigns and multiple categories, which means we can tell you exactly what "good" looks like for your specific product type, price point, and competitive landscape.
The Cost of Waiting: Why 2025 Benchmarks Will Be Harder to Hit in 2026
Let's talk about the elephant in the room: the window of opportunity on TikTok Shop is narrowing.
Right now, CPMs on TikTok Shop ads are still 30–50% lower than equivalent Meta placements for most commerce categories, according to aggregated industry data from multiple ad management platforms. That gap is closing every quarter as more advertisers enter the ecosystem.
Consider the trajectory:
- 2023: Early adopters enjoyed CPMs under $5 and minimal competition. ROAS was almost effortless.
- 2024: CPMs rose 25–40% as TikTok Shop expanded to more sellers. Competition intensified, but smart advertisers still found significant arbitrage.
- 2025: We're in the "golden window" — CPMs are competitive but still favorable, the algorithm rewards quality advertisers, and there's enough volume to scale aggressively.
- 2026 (projected): CPMs will approach Meta-level pricing in top categories. The brands that built algorithmic advantage and creator networks in 2025 will maintain favorable economics. Everyone else will face the same expensive, competitive landscape they're trying to escape on Meta.
The brands building now will own the algorithmic advantage that latecomers can't replicate. TikTok's algorithm learns from your historical performance data. Accounts with strong conversion histories receive preferential ad delivery — lower CPMs, broader reach, better placement. That advantage compounds over time.
Every month you delay is a month your competitors are training the algorithm in their favor.
Your Next Move: From Benchmarks to Breakthrough
You now have the most detailed set of TikTok Shop ad benchmarks for 2025 available anywhere — segmented by category, price point, ad format, and creative fatigue rate.
But benchmarks are just the starting line. The question is: what are you going to do with them?
If your numbers are in the top quartile — congratulations. You're in the minority, and you should be thinking about how to scale what's working before competitors catch up.
If your numbers are average or below — you now know exactly how much revenue you're leaving on the table. The gap between your current performance and top-quartile benchmarks isn't a mystery anymore. It's a math problem. And math problems have solutions.
The fastest path from average to top-quartile is working with a team that's already solved this problem hundreds of times.
MomentIQ helps brands close the benchmark gap through algorithmic creator matching, scaled content production, multi-format ad optimization, and full-stack TikTok Shop commerce support. We're the TikTok Shop Partner of the Year for a reason — our brands consistently outperform category benchmarks because we bring the systems, data, and creator networks that make top-quartile performance repeatable.
Book your free TikTok Shop growth audit at bemomentiq.com. We'll analyze your current ad performance against these benchmarks, identify your highest-leverage improvement opportunities, and build a custom scaling roadmap — whether you're spending $5K or $100K per month.
The brands that will dominate TikTok Shop in 2025 aren't the ones with the biggest budgets. They're the ones with the best systems. And the best time to build those systems was six months ago. The second-best time is right now.